

 Australia
 New Zealand
 Other Countries
 24/7 Support
Published 9 Sept 2026
Car accidents in Australia have shown a steady increase over recent years, raising concerns about road safety. High-speed zones and urban areas remain common hotspots for these incidents.
How many road fatalities occur in Australia annually?
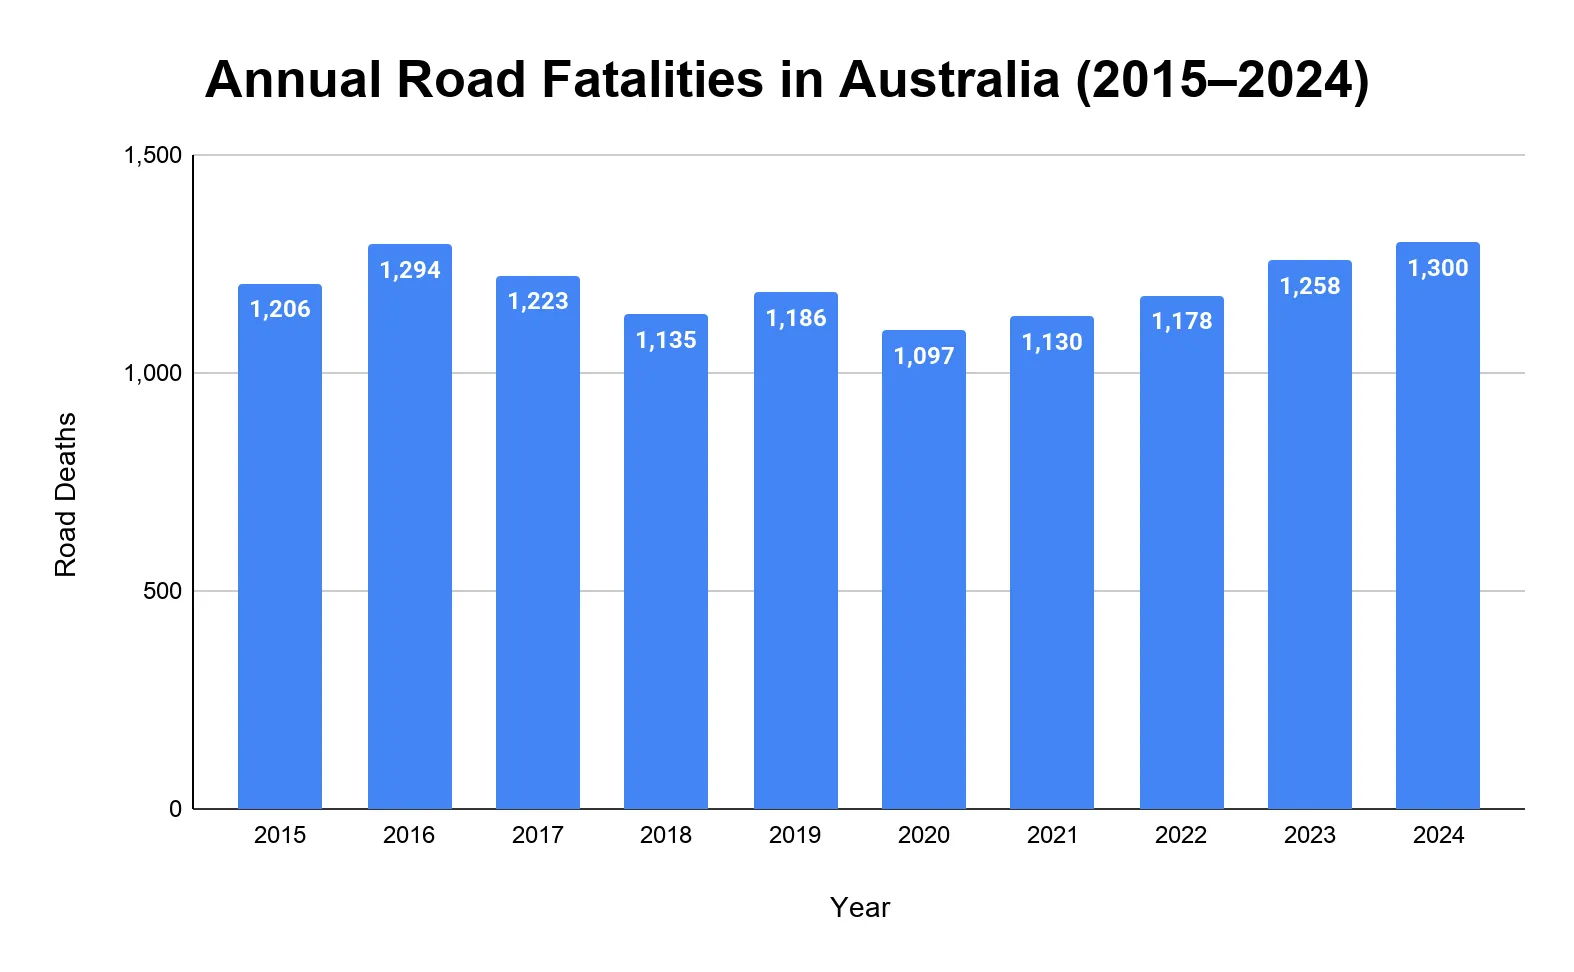
Australia recorded 1,300 road crash deaths in 2024, up 3.3% from 1,258 deaths in 2023. The latest monthly road deaths data shows 1,332 road deaths in the 12 months ending May 2026.
- Annual road deaths increased from 1,097 in 2020 to 1,130 in 2021 and 1,178 in 2022.
- Road deaths rose again to 1,258 in 2023 and 1,300 in 2024.
- The latest monthly update recorded 118 road deaths in May 2026.
- From January to May 2026, Australia recorded 573 road deaths, up 3.8% from 552 deaths during the same period in 2025.
- In the 12 months ending May 2026, Australia recorded 1,332 road deaths, up 0.8% from the previous 12-month period.
What is the average number of road fatalities per day/week/month in Australia?
Australia averaged about 3.6 road deaths per day in the 12 months ending May 2026.
- The latest rolling 12-month period recorded 1,332 road deaths, equal to about 3.6 deaths per day.
- That same period averaged about 25.5 road deaths per week.
- Monthly road deaths averaged about 111 deaths per month.
Note: Daily, weekly, and monthly averages are calculated from 1,332 road deaths in the 12 months ending May 2026.
How has the road fatality rate in Australia changed over the years?
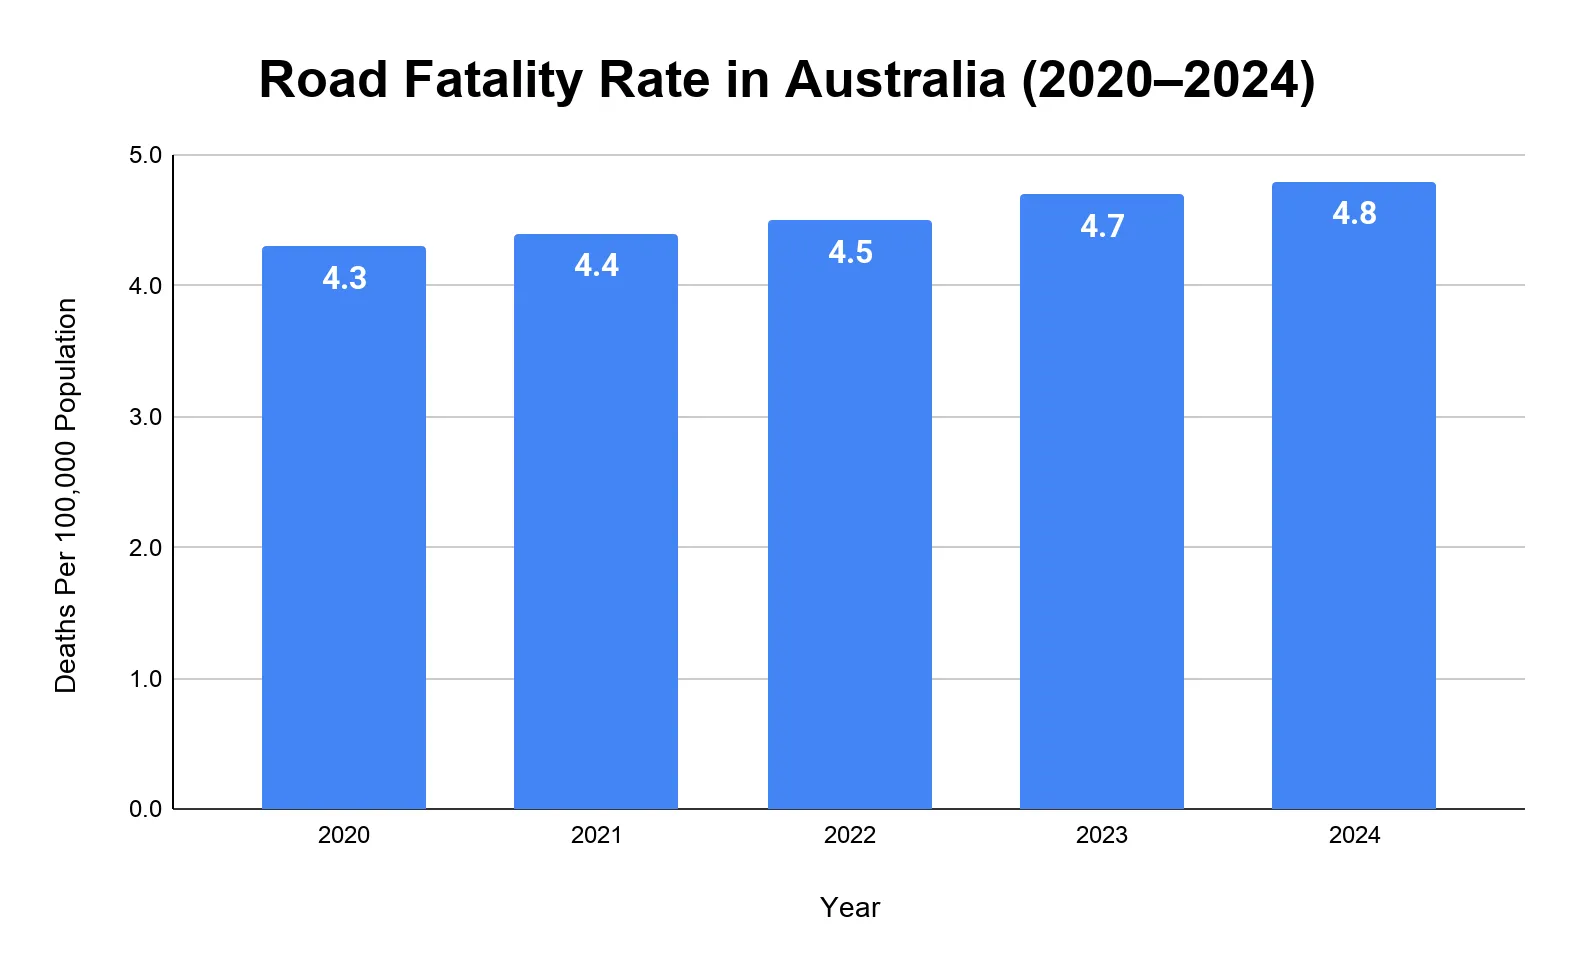
Australia’s annual road fatality rate reached 4.8 deaths per 100,000 population in 2024. The latest rolling 12-month rate also stood at 4.8 deaths per 100,000 people for the 12 months ending May 2026.
- The fatality rate stood at 4.3 deaths per 100,000 population in 2020.
- The rate increased to 4.4 in 2021 and 4.5 in 2022.
- Australia’s road fatality rate rose to 4.7 in 2023.
- The rate reached 4.8 in 2024, following the post-2020 increase in annual road deaths.
- For the 12 months ending May 2026, the rolling fatality rate was also 4.8 deaths per 100,000 people.
Demographic Profile of Road Fatality Victims
Which age group accounts for the most road deaths in Australia?
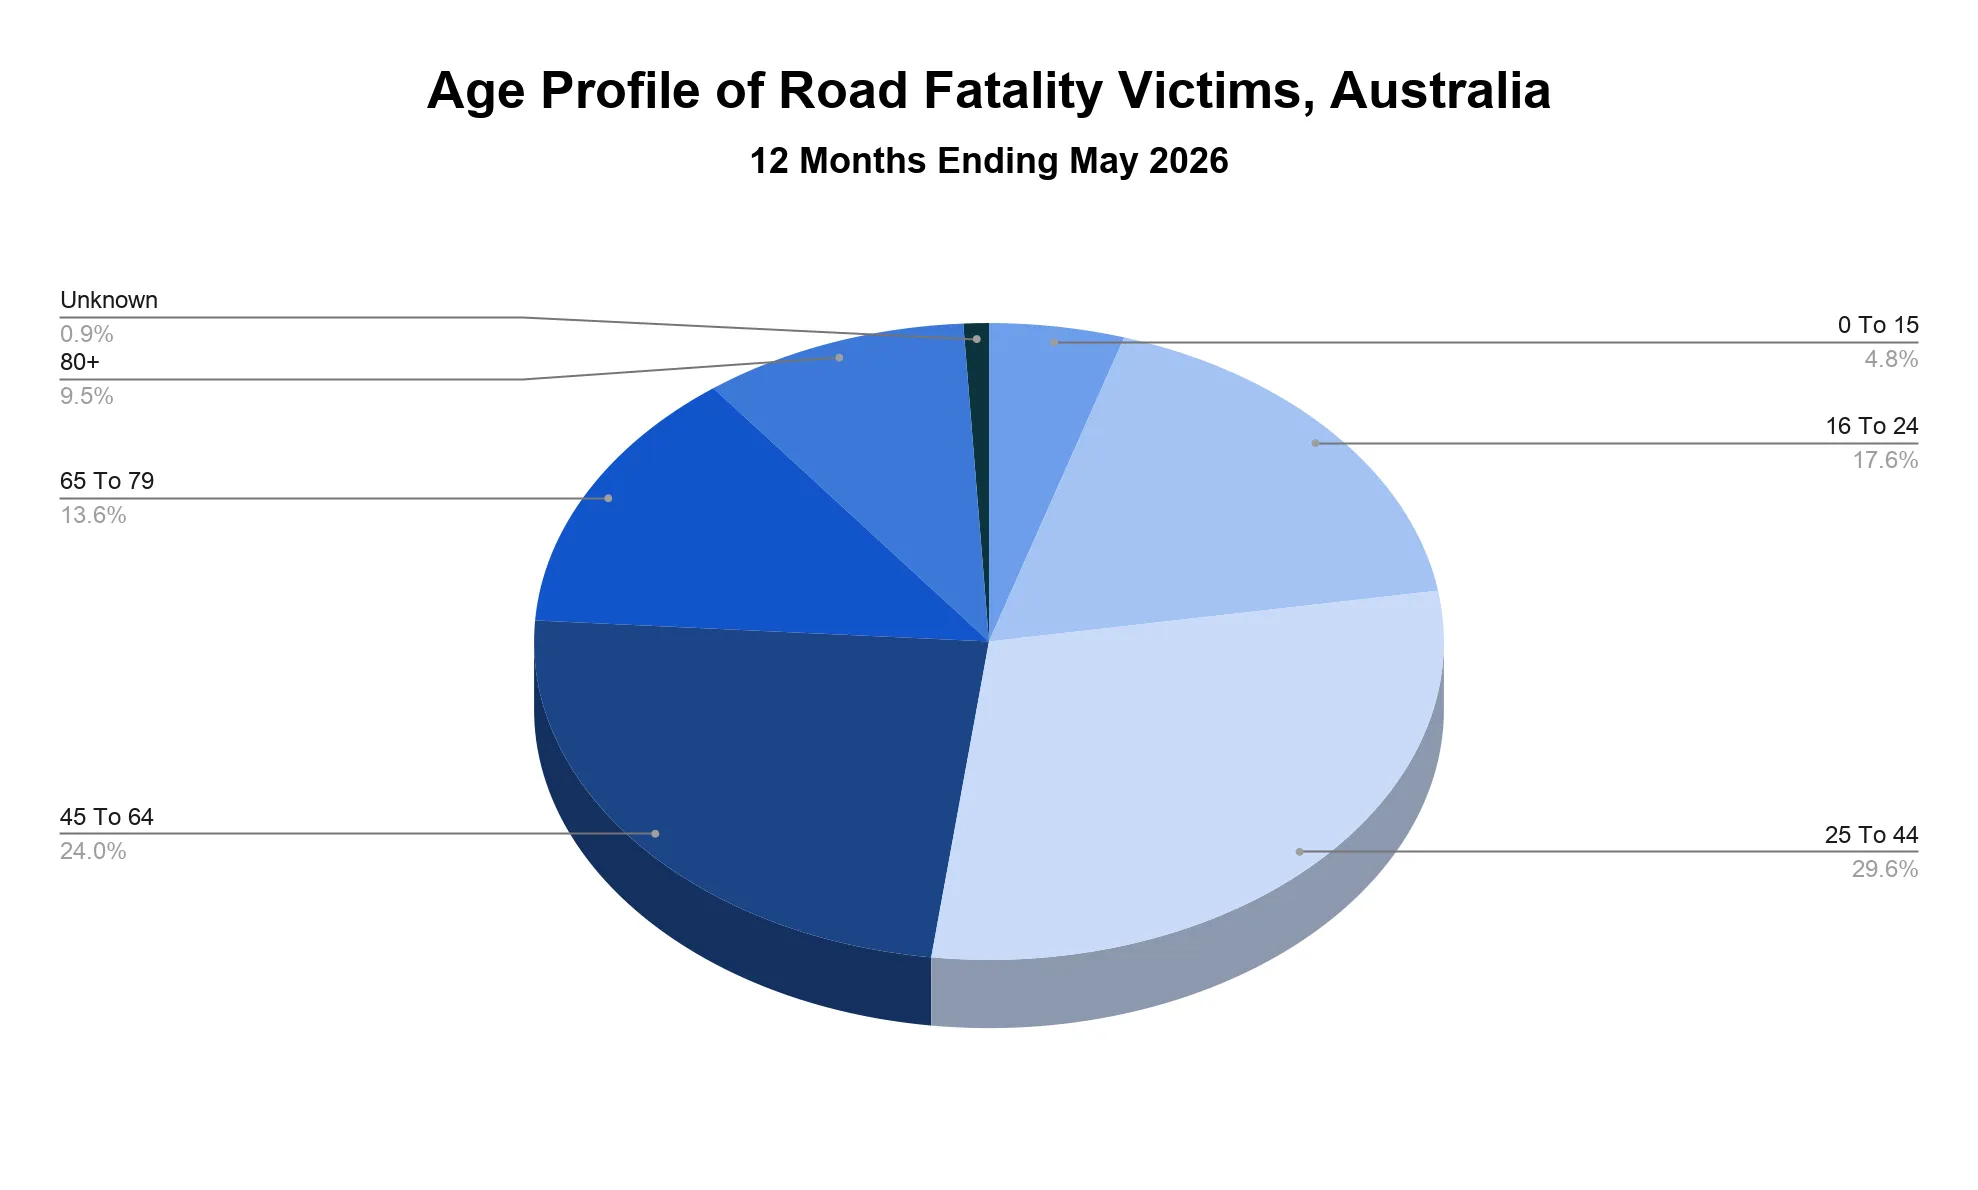
People aged 25 to 44 years accounted for the largest share of Australian road deaths in the 12 months ending May 2026, with 394 deaths.
- People aged 25 to 44 years accounted for 394 road deaths, or 29.6% of total road deaths.
- People aged 45 to 64 years followed with 320 deaths, or 24.0% of the total.
- People aged 16 to 24 years accounted for 235 deaths, up 13.0% from the previous 12-month period.
- People aged 65 to 79 years accounted for 181 deaths, while those aged 80 years and over accounted for 126 deaths.
- Children aged 0 to 15 years accounted for 64 deaths.
Who were the victims of road fatalities in Australia?
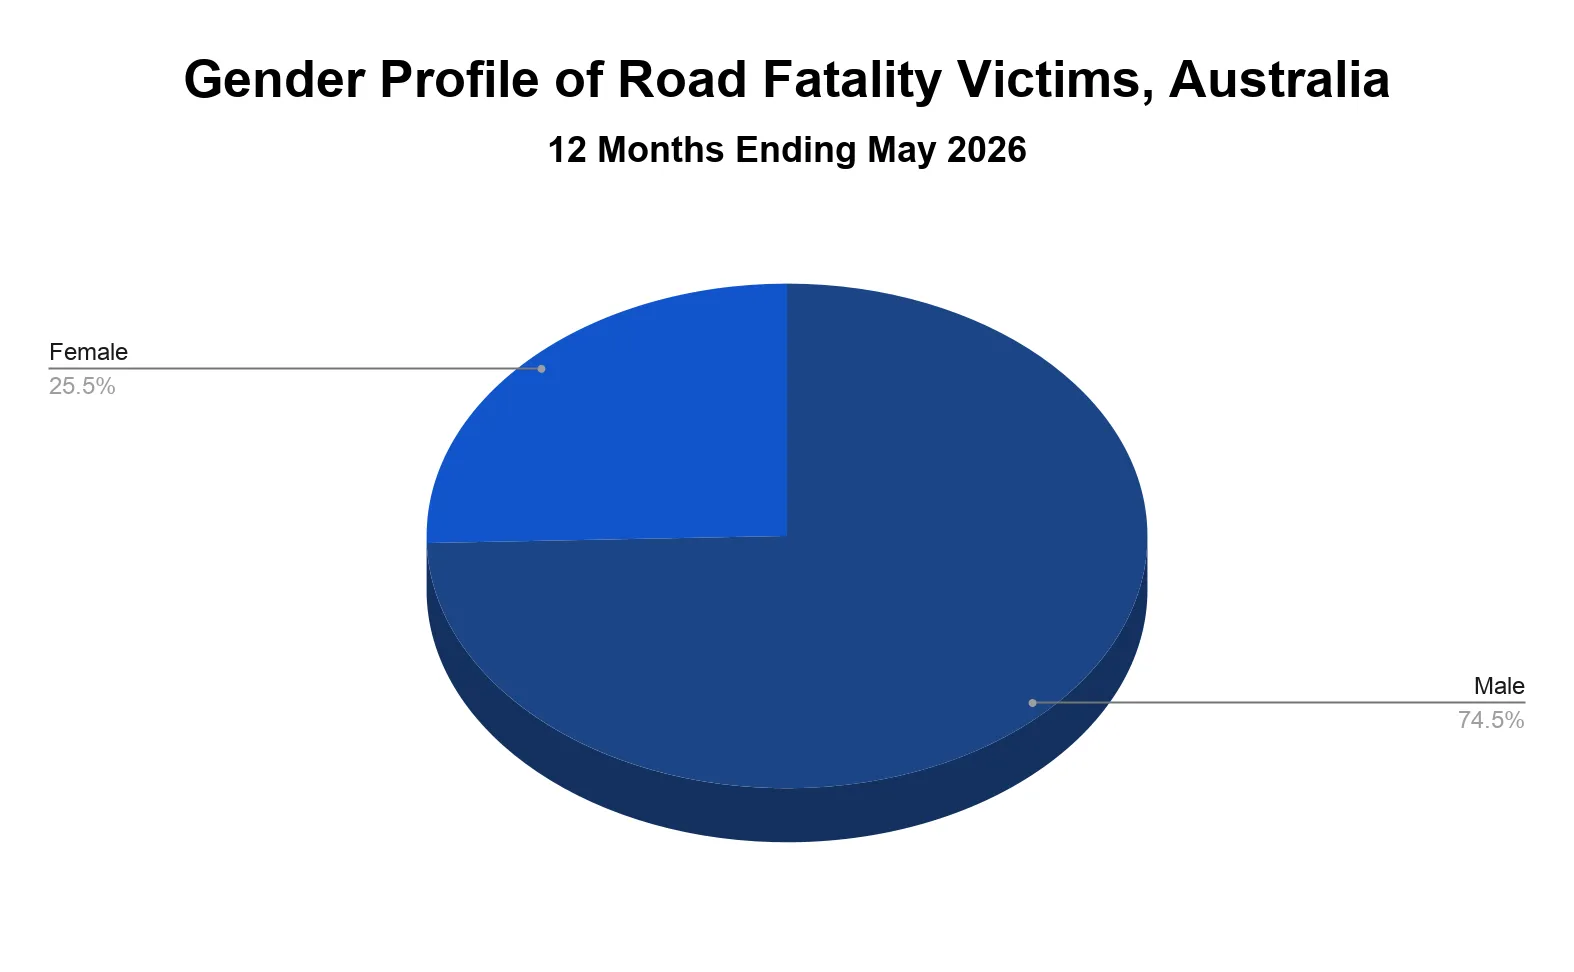
Males accounted for about 74.5% of Australian road deaths in the 12 months ending May 2026.
- 993 males died in road crashes in the 12 months ending May 2026.
- 339 females died in road crashes during the same period.
- Male road deaths were about 2.9 times higher than female road deaths.
Which Australian regions have the highest road fatality rates?
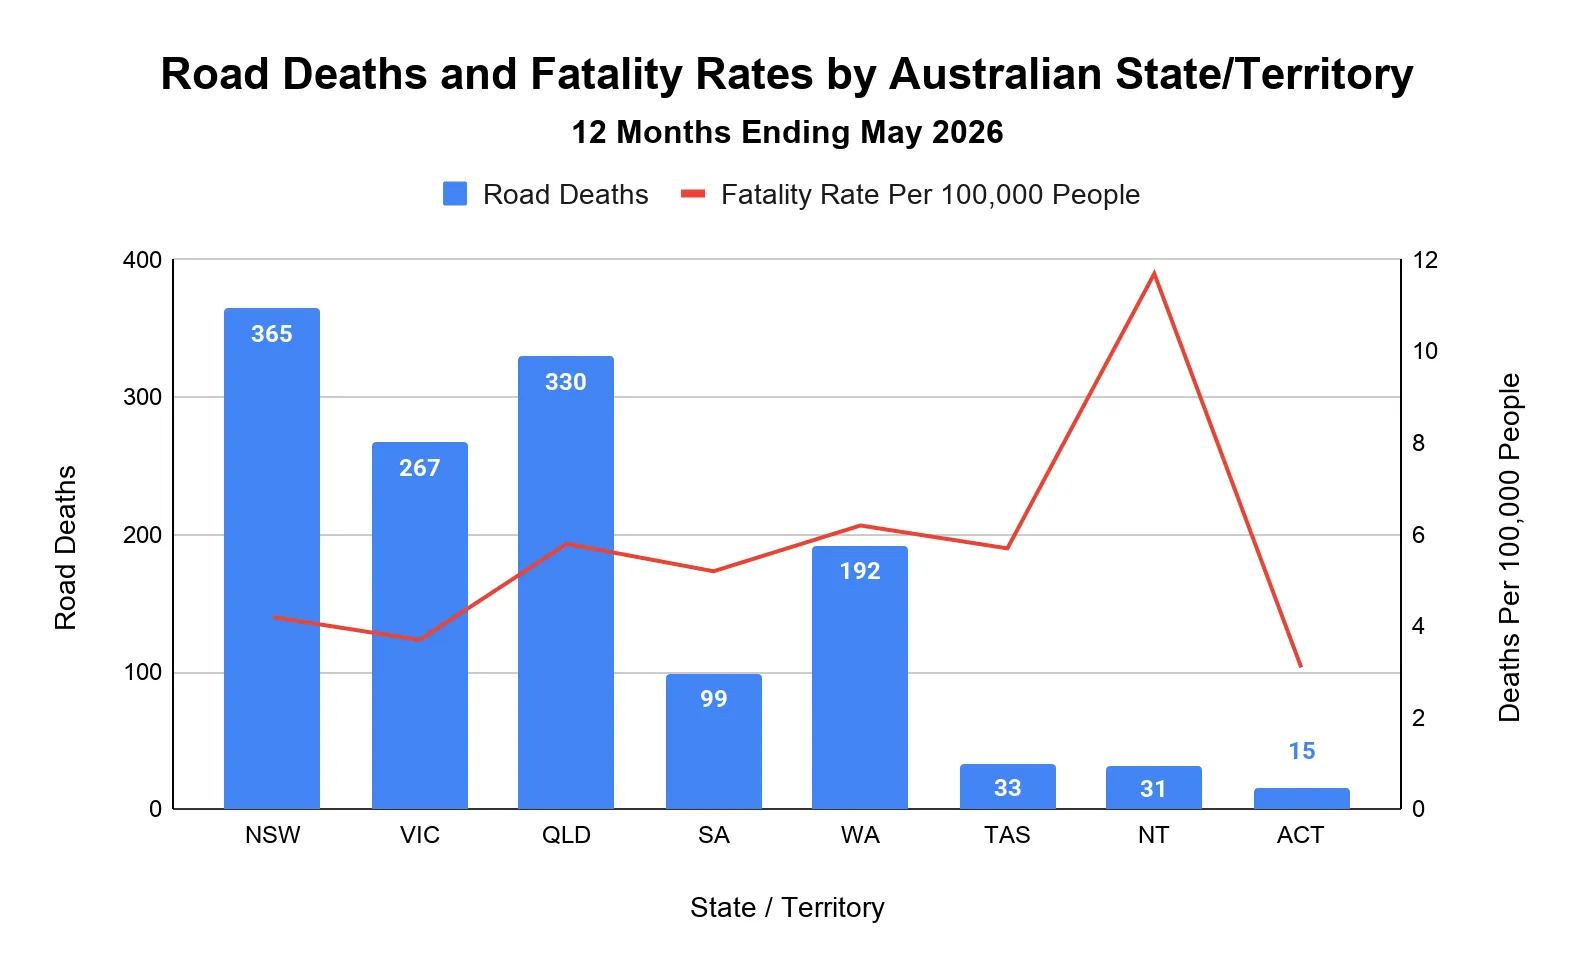
The Northern Territory had the highest road fatality rate in Australia at 11.7 deaths per 100,000 people in the 12 months ending May 2026. New South Wales recorded the highest number of road deaths, with 365 deaths.
- The Northern Territory recorded 31 road deaths and the highest rate at 11.7 deaths per 100,000 people.
- Western Australia had the second-highest fatality rate at 6.2 deaths per 100,000 people, with 192 deaths.
- Queensland recorded 330 deaths and a rate of 5.8 deaths per 100,000 people.
- Tasmania recorded 33 deaths and a rate of 5.7 deaths per 100,000 people.
- New South Wales recorded the most road deaths at 365, with a rate of 4.2 deaths per 100,000 people.
- The Australian Capital Territory recorded 15 deaths and the lowest rate at 3.1 deaths per 100,000 people.
How many road deaths occur in remote areas?
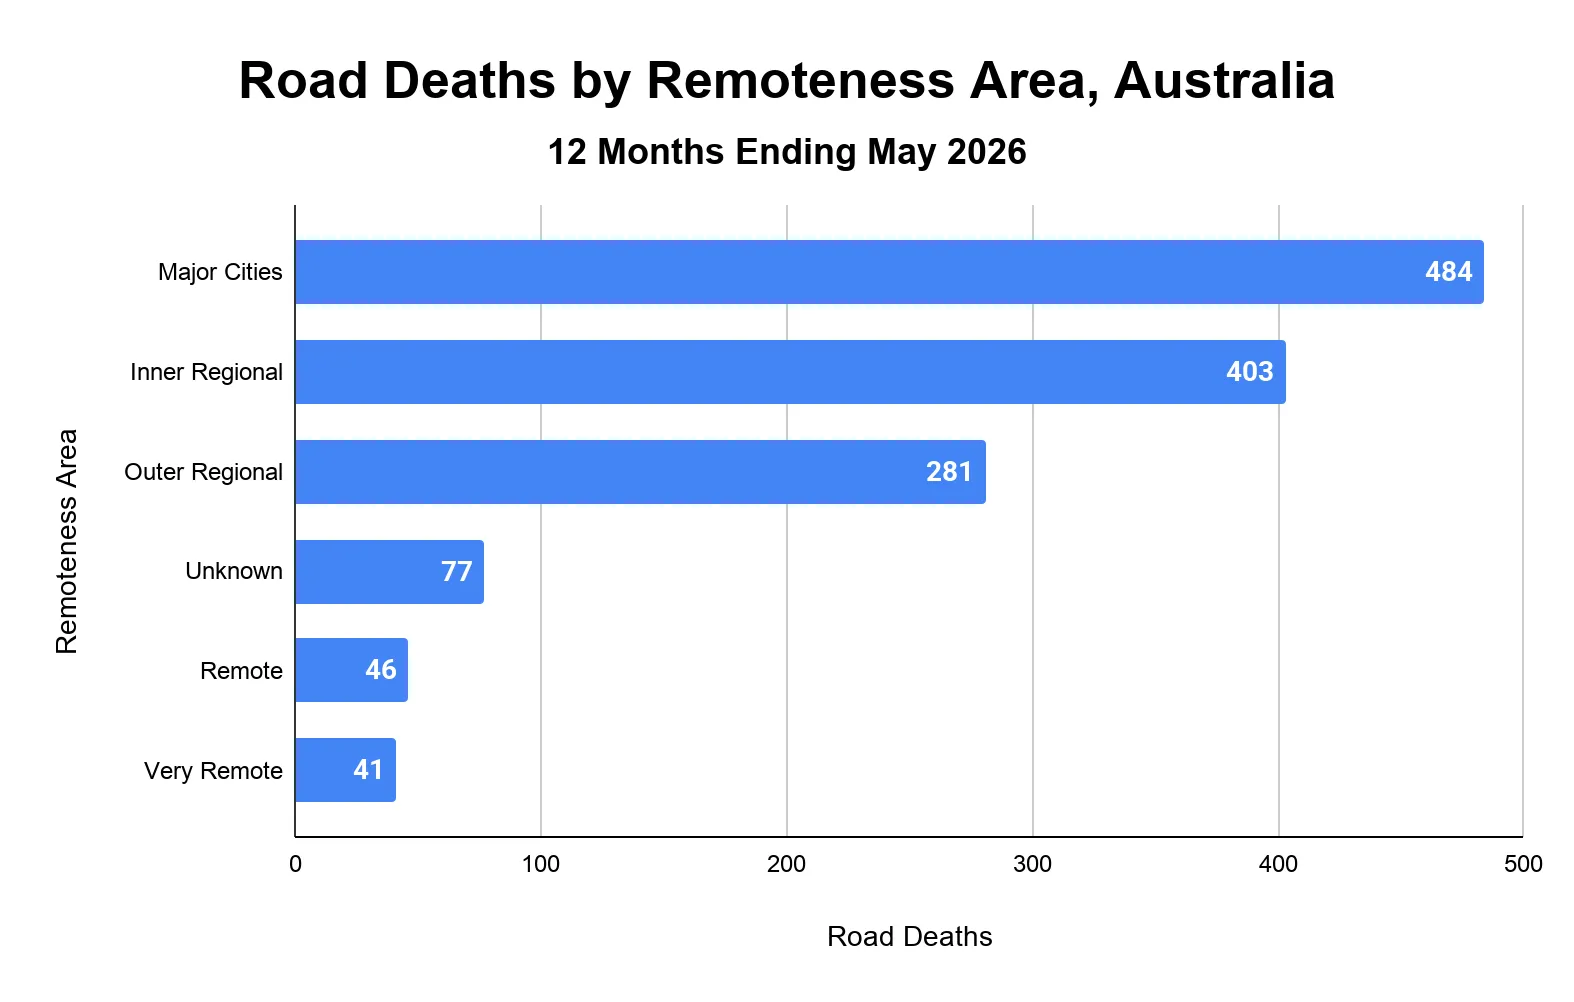
Major city areas recorded the most road deaths in the 12 months ending May 2026, with 484 deaths.
- Major cities recorded 484 road deaths, or 36.3% of total road deaths.
- Inner Regional Australia followed with 403 deaths.
- Outer Regional Australia recorded 281 deaths.
- Remote Australia recorded 46 deaths, while Very Remote Australia recorded 41 deaths.
- 77 deaths were listed under unknown remoteness.
How do road deaths vary month by month in Australia?
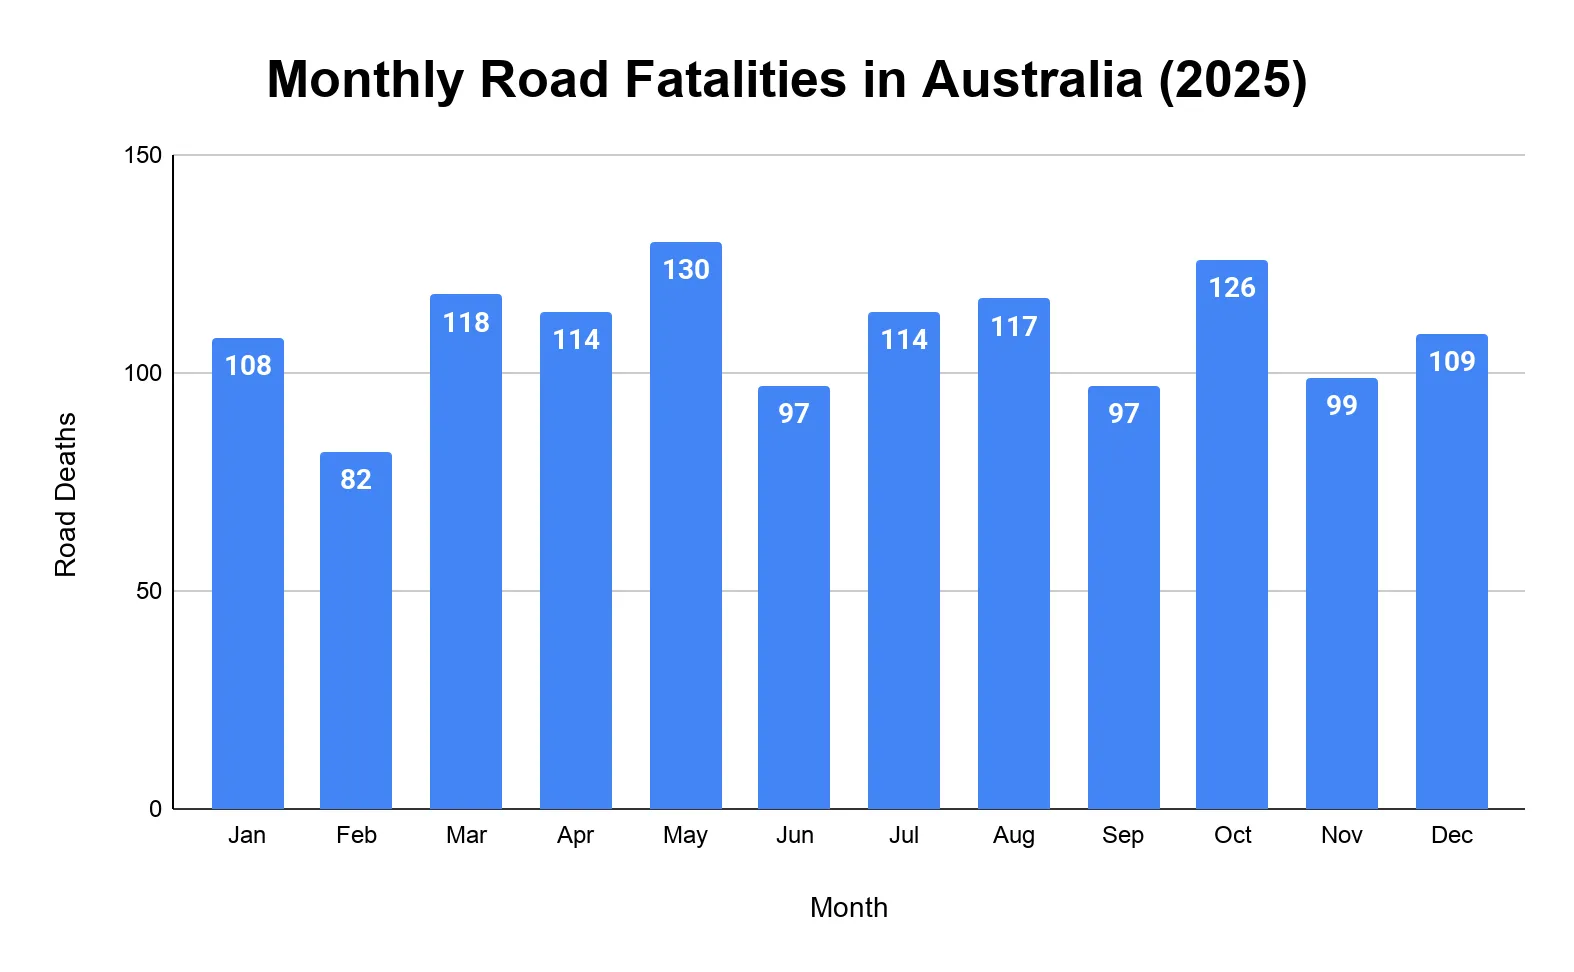
May recorded the highest number of road deaths in Australia in 2025, with 130 deaths.
- May: 130 deaths
- October: 126 deaths
- March: 118 deaths
- August: 117 deaths
- April and July: 114 deaths each
How many fatal crashes occur annually in Australia?
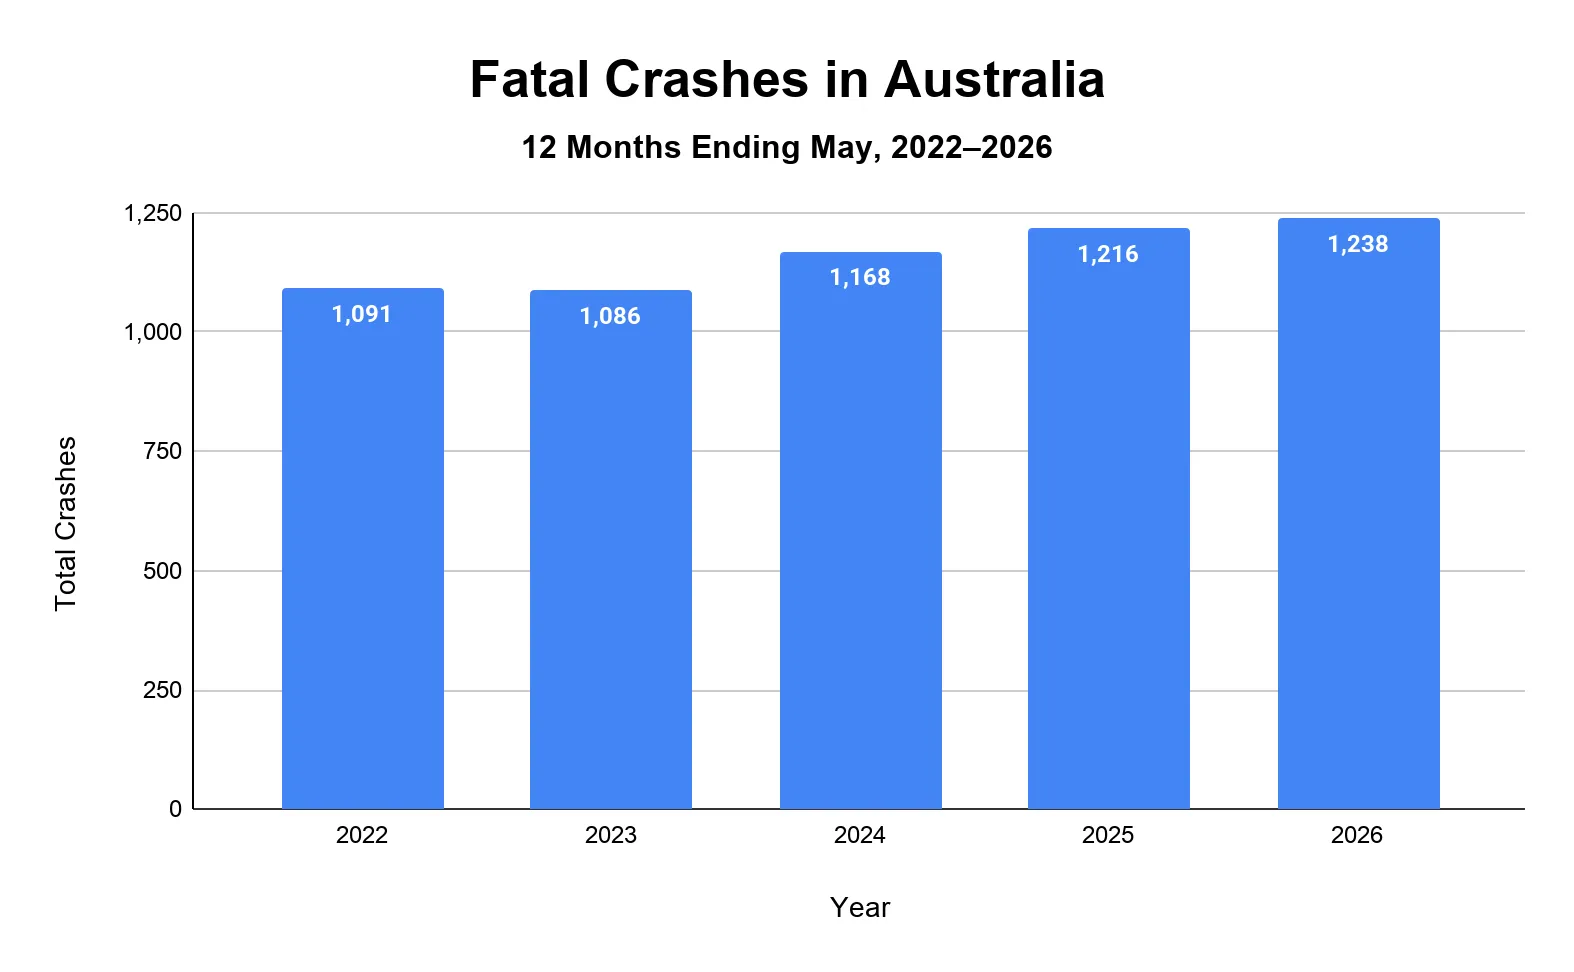
Australia recorded 1,238 fatal crashes in the 12 months ending May 2026, up 1.8% from the previous 12-month period.
- Fatal crashes totalled 1,091 in the 12 months ending May 2022.
- The total was 1,086 in the 12 months ending May 2023.
- Fatal crashes rose to 1,168 in the 12 months ending May 2024.
- The number increased again to 1,216 in the 12 months ending May 2025.
- Australia recorded 1,238 fatal crashes in the 12 months ending May 2026.
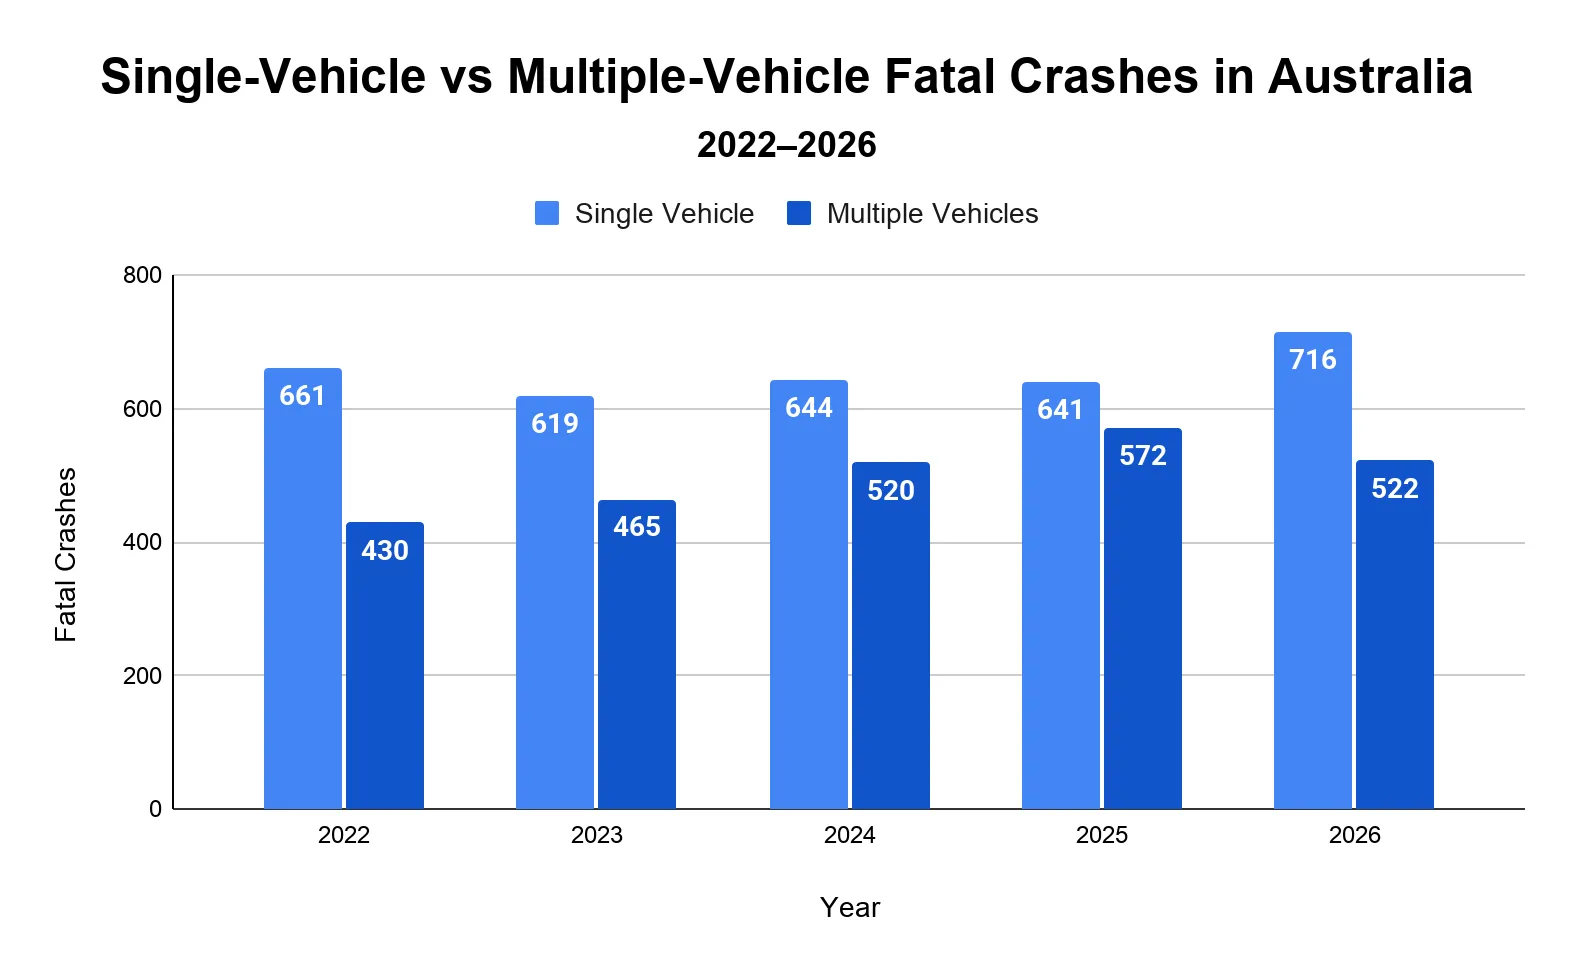
How do single-vehicle and multiple-vehicle fatal crashes compare in Australia?
Single-vehicle crashes accounted for the larger share of fatal crashes in the 12 months ending May 2026, with 716 fatal crashes.
- Australia recorded 716 single-vehicle fatal crashes in the 12 months ending May 2026.
- Multiple-vehicle fatal crashes totalled 522 in the same period.
- Single-vehicle fatal crashes increased by 11.7% from the previous 12-month period.
- Multiple-vehicle fatal crashes decreased by 8.7% from the previous 12-month period.
- Single-vehicle crashes accounted for 57.8% of fatal crashes in the latest period.
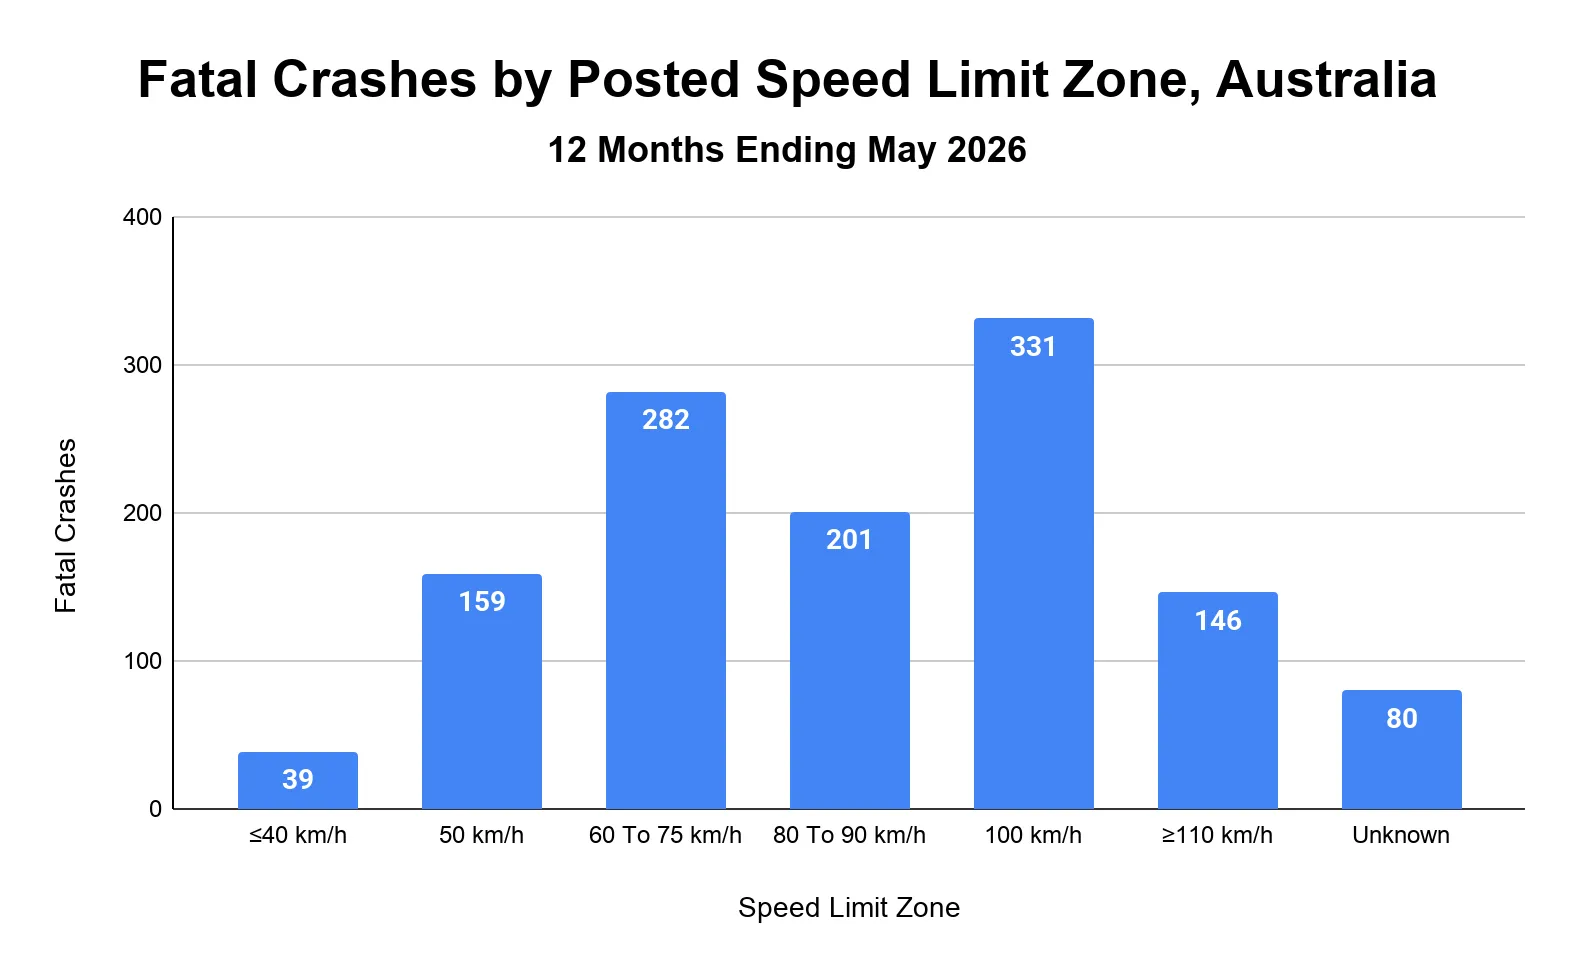
How many fatal crashes occurred in each speed limit zone?
The highest number of fatal crashes occurred in 100 km/h zones in the 12 months ending May 2026, with 331 fatal crashes.
- 100 km/h zones recorded 331 fatal crashes, or 26.7% of all fatal crashes.
- 60 to 75 km/h zones followed with 282 fatal crashes.
- 80 to 90 km/h zones recorded 201 fatal crashes.
- 50 km/h zones recorded 159 fatal crashes, up 23.3% from the previous 12-month period.
- ≥110 km/h zones recorded 146 fatal crashes, while ≤40 km/h zones recorded 39 fatal crashes.
What do Australians believe are the most common causes of car accidents?
A 2024 Budget Direct survey found that Australian respondents most commonly believed speeding was the leading cause of car accidents.
- 59% of respondents believed speeding was the leading cause of car accidents.
- 30% of respondents believed tailgating or aggressive driving was the second-leading cause.
- Other ranked causes included distracted driving, failure to give way, driving through a red light, driving tired, driving drunk, and poorly designed roads or intersections.
Note: This section is based on survey responses about perceived causes of car accidents. It should not be read as official crash-causation data.
What is the average cost of car insurance claims related to accidents in Australia?
The average private motor insurance claim size increased by 42.2% from June 2019 to June 2024.
- Average claim size rose from $3,658 in June 2019 to $5,202 in June 2024.
- The Insurance Council of Australia identified rising claims costs as a primary driver of motor insurance premium increases.
- Higher claims costs reflect increased vehicle replacement costs, parts costs, labour costs, and vehicle technology complexity.
- Repair costs account for about 60% of motor insurance claims costs, while total-loss claims account for about 25%.
References
- NRSD: Road Safety Fatality and Crash Data (2015–2026) · datahub.roadsafety.gov.au
- Road Trip Survey Data (2025) · budgetdirect.com.au
- ICA: Motor Insurance Premium, Claims Cost, Repair Cost, and Theft-Claims Trends (2019–2025) · insurancecouncil.com.au