

 Australia
 New Zealand
 Other Countries
 24/7 Support
Published 9 Sept 2026
How many new vehicles are sold in Australia each year?
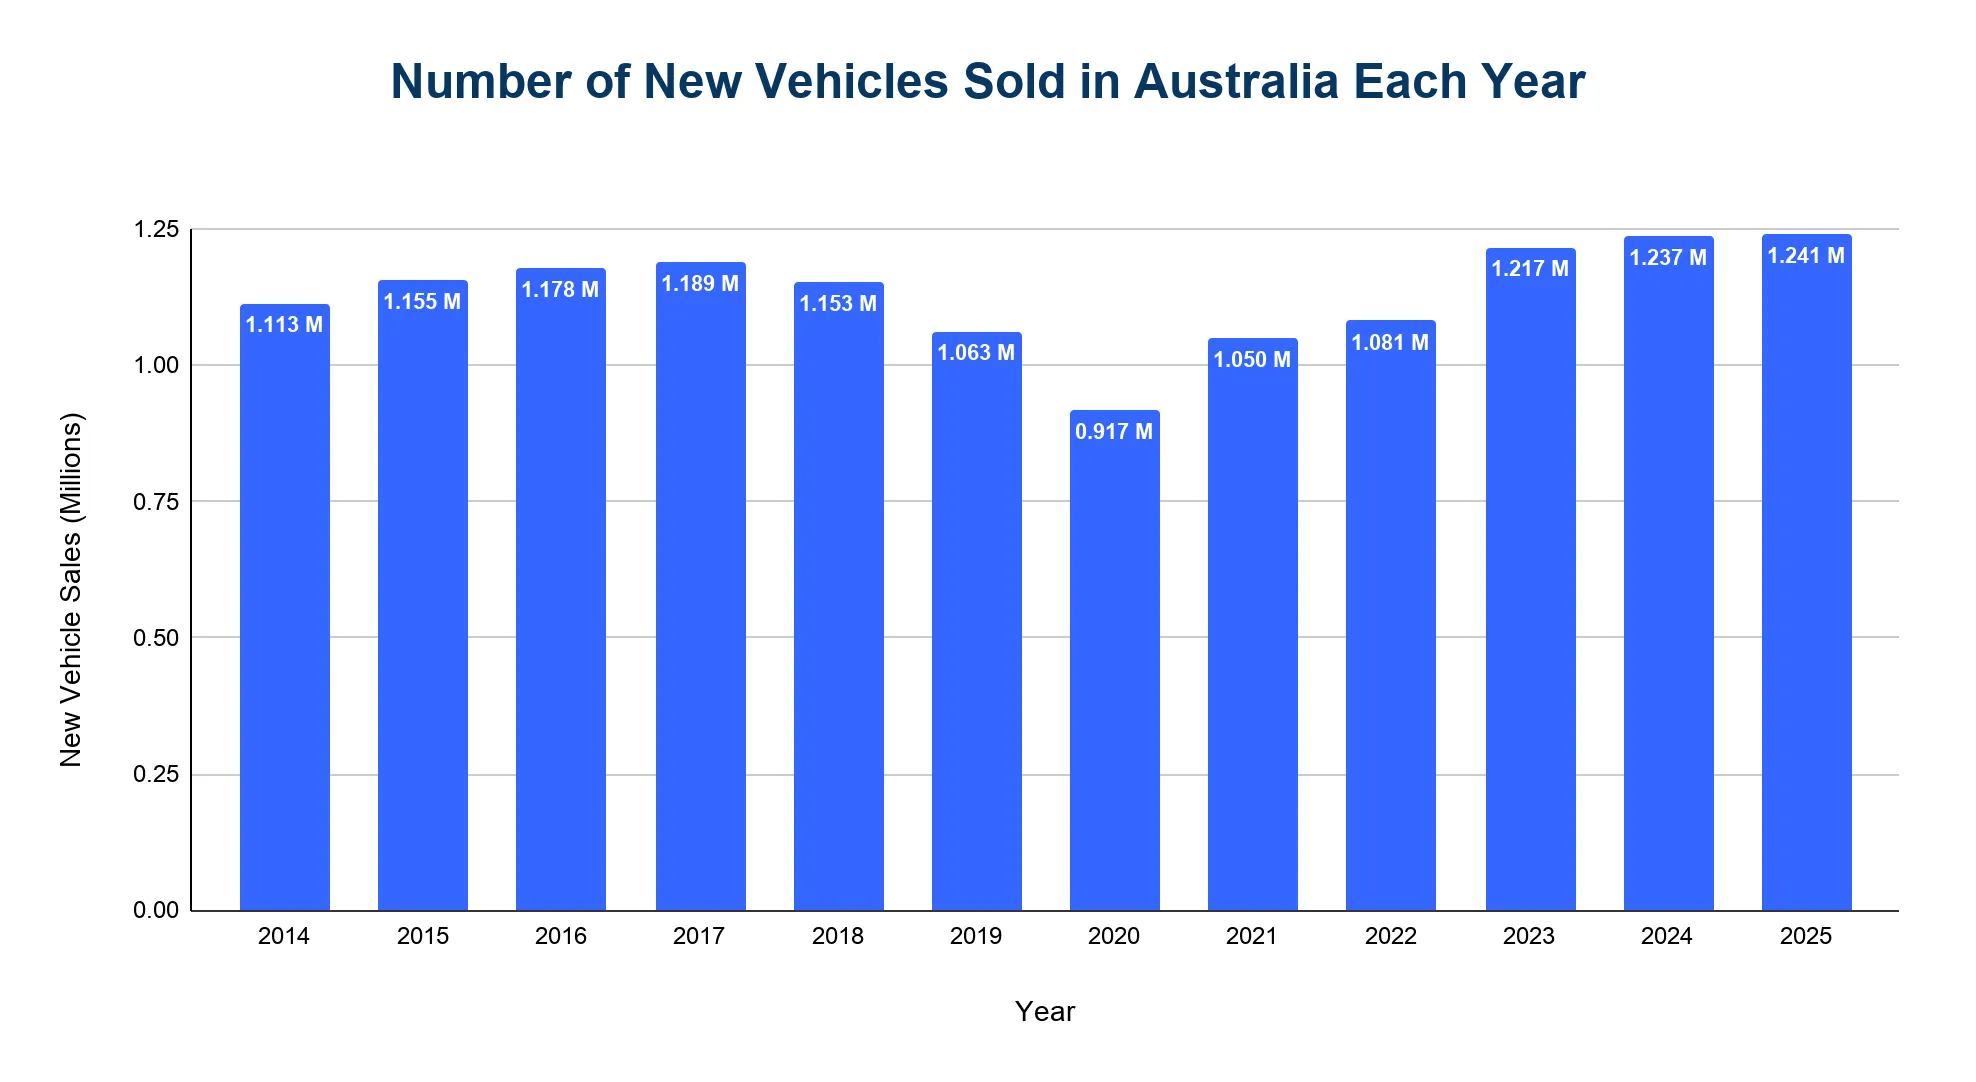
Australia recorded 1,241,037 new vehicle sales in 2025, a 0.3% increase from 2024.
- New vehicle sales remained above 1.2 million for the third consecutive year, following 1,216,780 sales in 2023 and 1,237,287 in 2024.
- The 2025 total includes new vehicles reported through the Federal Chamber of Automotive Industries (FCAI) and Electric Vehicle Council sales data.
- The broader new-vehicle market includes passenger vehicles, sport utility vehicles (SUVs), light commercial vehicles, and heavy commercial vehicles.
Sales by Fuel Type
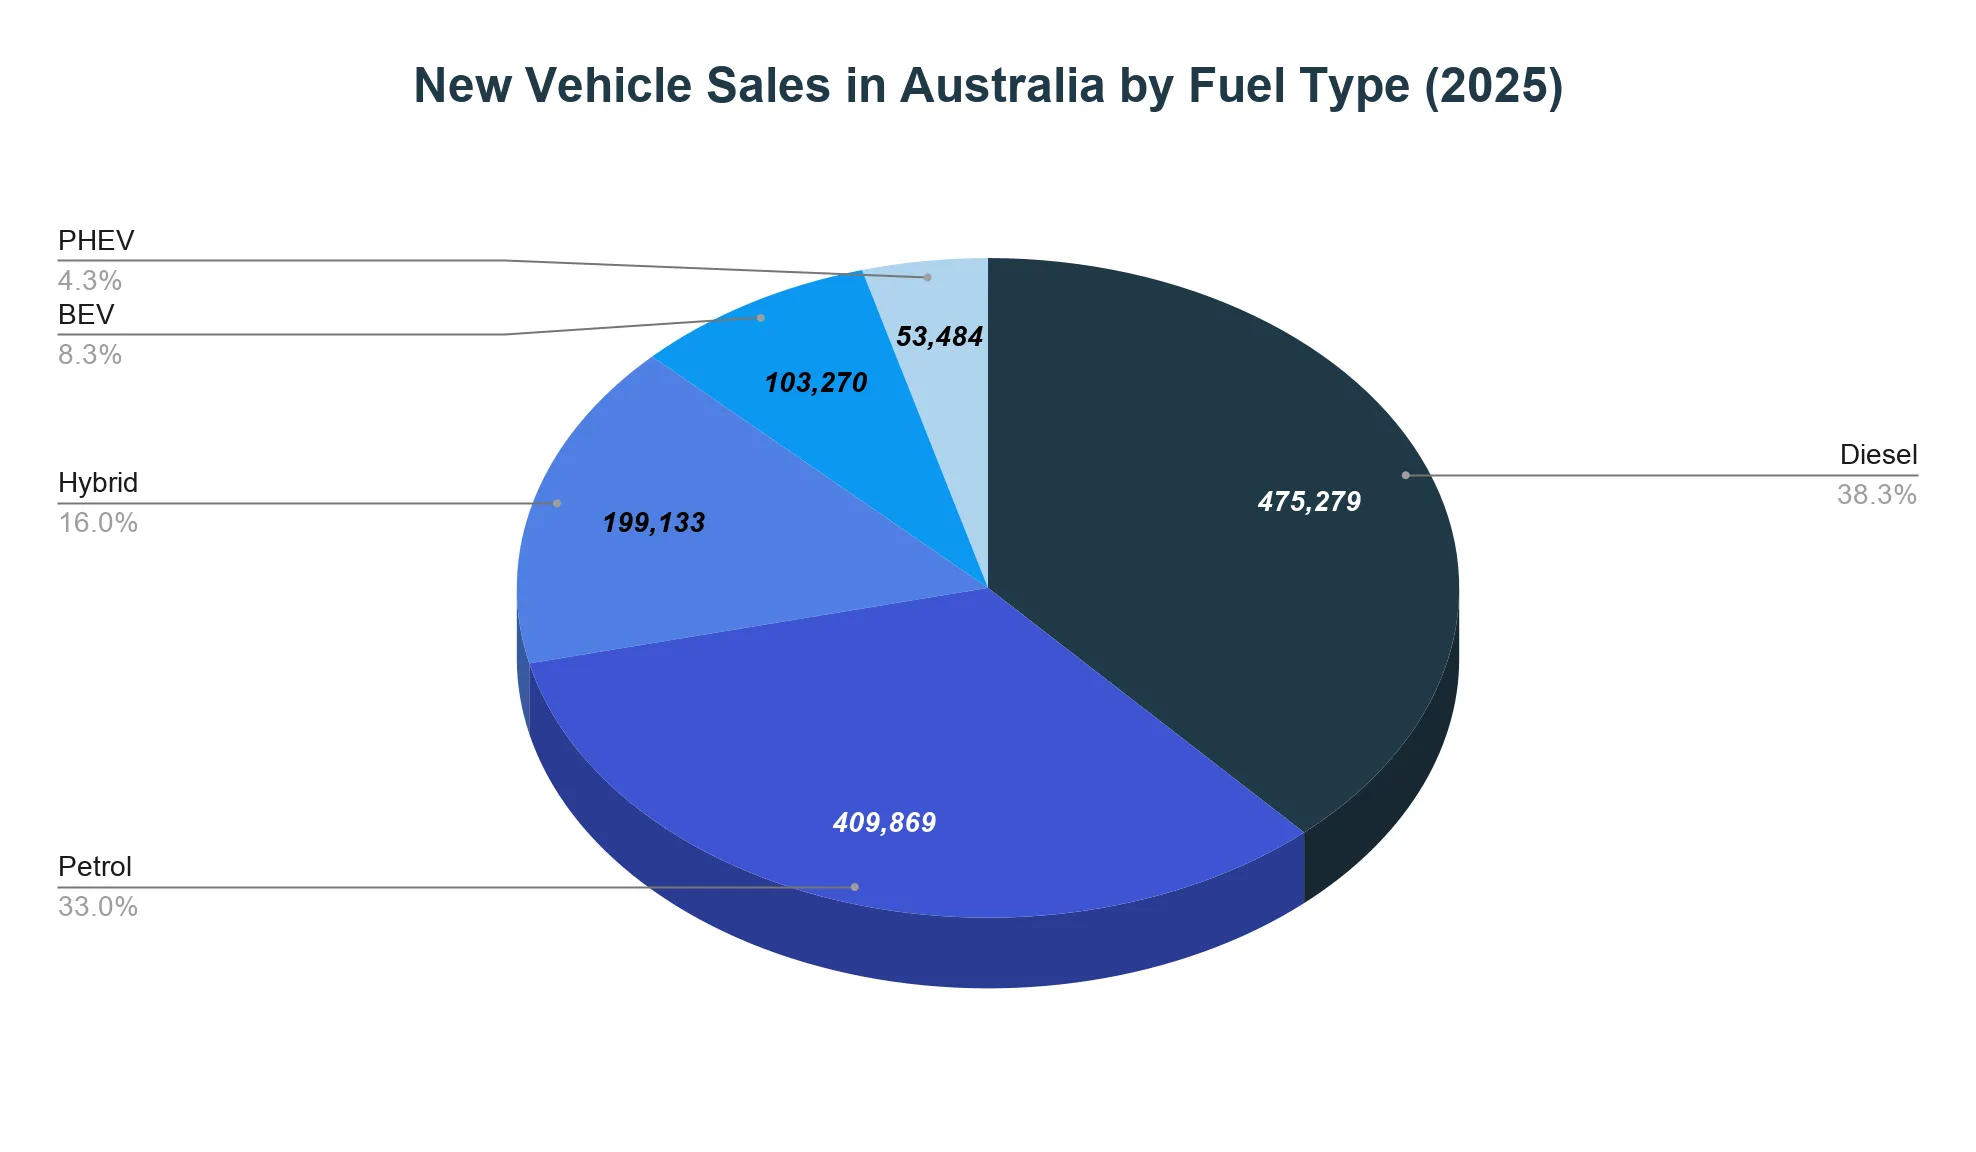
- Diesel vehicles led Australia’s 2025 new-vehicle market with 475,279 sales, followed by petrol vehicles with 409,869 sales.
- Hybrid vehicles reached 199,133 sales, making them the largest lower-emissions fuel type in the market.
- Battery electric vehicles (BEVs) reached 103,270 sales, while plug-in hybrid electric vehicles (PHEVs) reached 53,484 sales.
Sales by Buyer Types
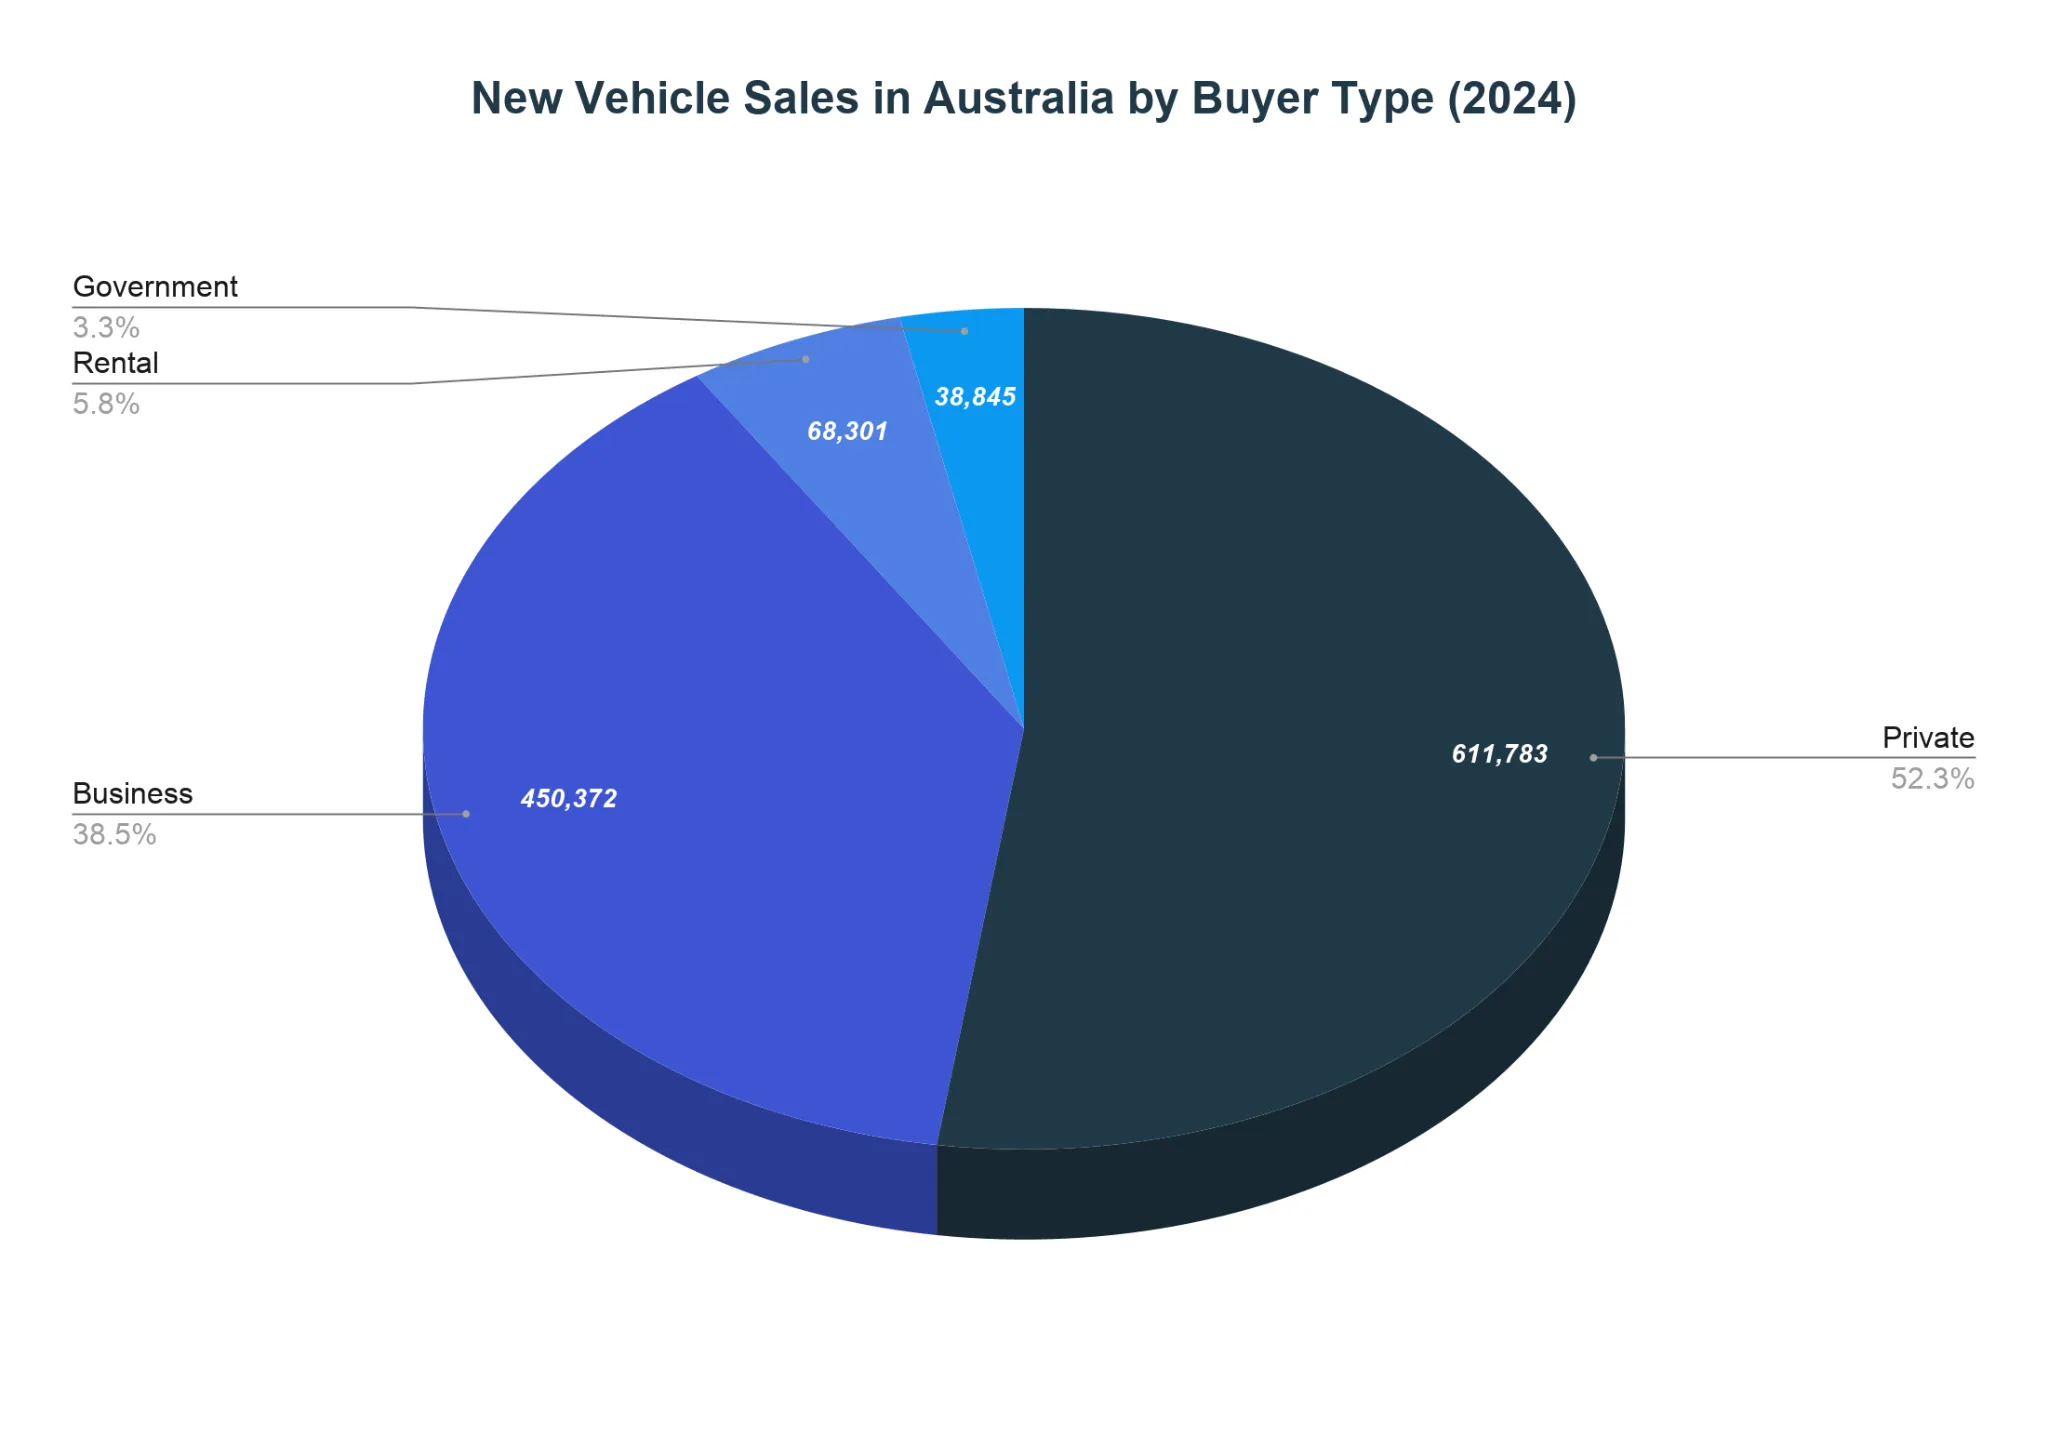
- Private buyers made up the largest buyer segment in 2024, purchasing 611,783 new vehicles.
- Business buyers followed with 450,372 new vehicles.
- Rental companies accounted for 68,301 new vehicles, while government purchases totalled 38,845.
How much of the Australian new vehicle market is electrified?
Electrified vehicle sales reached 355,887 units in 2025, equal to about 28.7% of Australia’s new-vehicle market.
- Hybrid vehicles accounted for 199,133 sales in 2025, making them the largest electrified category.
- Battery electric vehicles reached 103,270 sales, while plug-in hybrid electric vehicles reached 53,484 sales.
- Plug-in vehicles, including BEVs and PHEVs, totalled 156,754 sales and made up about 12.6% of new vehicle sales.
| Total Number of Electrified Vehicle Sales in Australia | |||||
|---|---|---|---|---|---|
| Year | BEV Sales | PHEV Sales | HEV Sales | Total Electrified Sales | Total Electrified Share |
| 2019 | 6,718 | 1,426 | 31,191 | 39,335 | 3.7% |
| 2020 | 6,900 | 1,685 | 60,417 | 69,002 | 7.5% |
| 2021 | 20,665 | 3,372 | 70,466 | 94,503 | 9.0% |
| 2022 | 33,410 | 5,937 | 81,786 | 121,133 | 11.2% |
| 2023 | 87,217 | 11,212 | 98,439 | 196,868 | 16.2% |
| 2024 | 91,292 | 23,163 | 172,696 | 287,151 | 23.2% |
| 2025 | 103,270 | 53,484 | 199,133 | 355,887 | 28.7% |
Source · Note: “Electrified vehicles” includes hybrid electric vehicles (HEVs), battery electric vehicles (BEVs), and plug-in hybrid electric vehicles (PHEVs). The 2025 total electrified share is calculated by dividing total electrified sales by total new vehicle sales.
Learn more about EV Sales in Australia.
How do new vehicle sales compare with used vehicle sales in Australia?
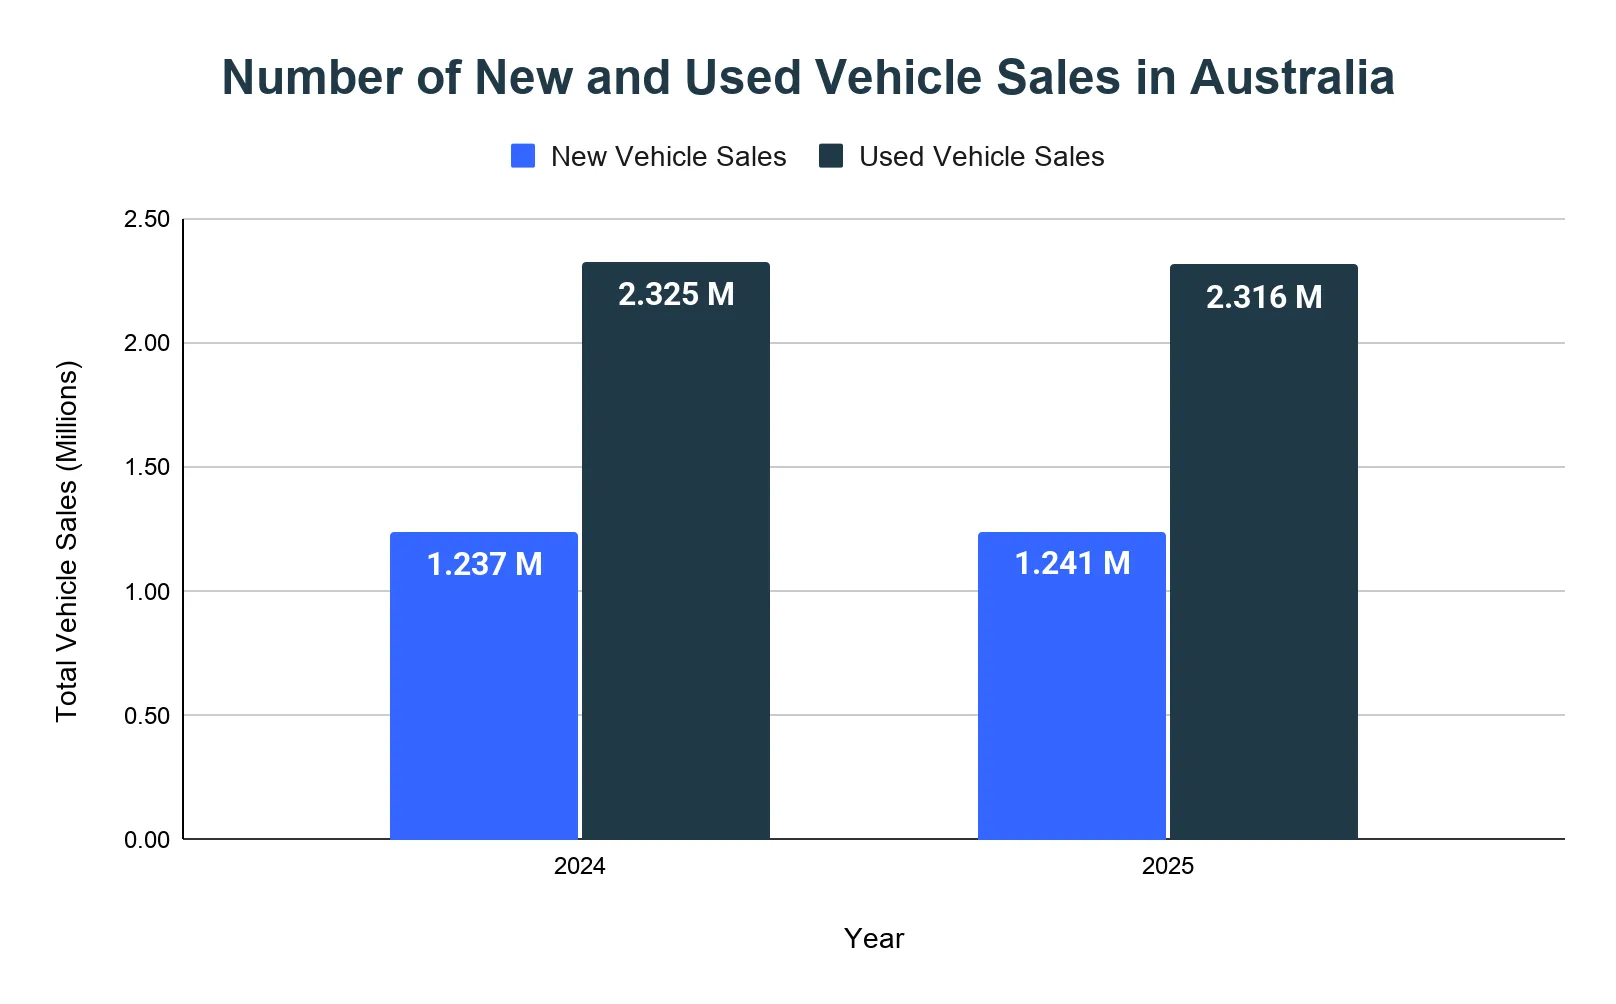
Australia recorded 1,241,037 new vehicle sales and 2,316,208 used vehicle sales in 2025.
- The used-vehicle market was about 1.87 times the size of the new-vehicle market in 2025.
- Used vehicle sales were slightly lower than 2024, when 2,324,805 used vehicles were sold.
- Dealer activity became more prominent in the used market, with dealers accounting for 48.6% of used vehicle sales in 2025, compared with 39.1% in 2024.
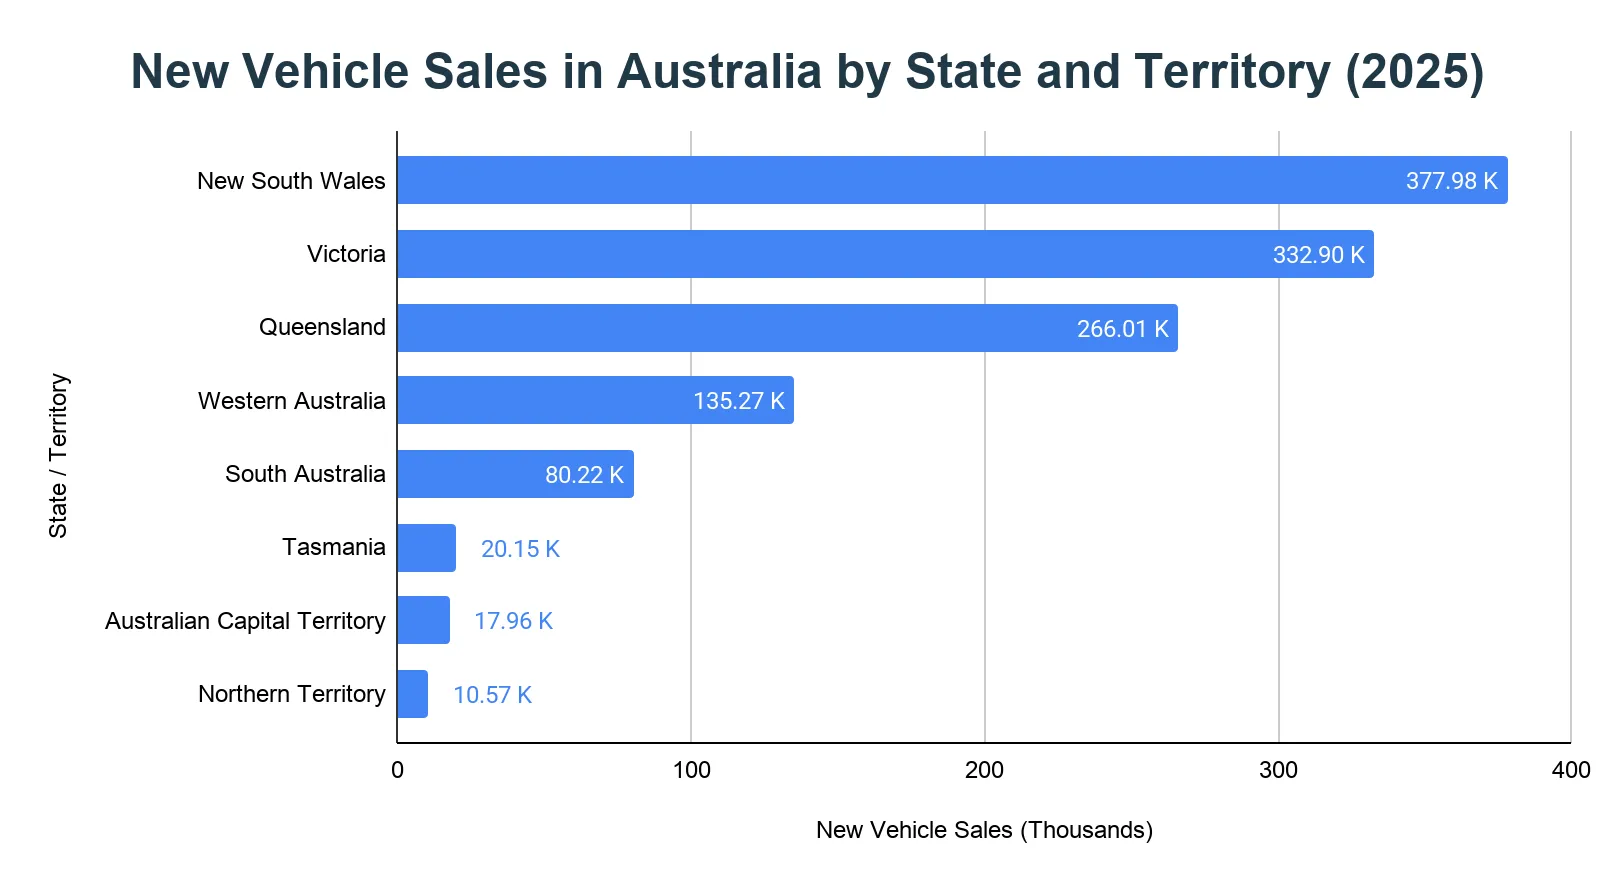
Regional Breakdown of Australian New Vehicle Sales
- New South Wales led Australia’s new-vehicle market in 2025 with 377,978 sales, followed by Victoria with 332,895 and Queensland with 266,007.
- Western Australia recorded 135,265 new vehicle sales, while South Australia recorded 80,217.
- Tasmania, the Australian Capital Territory, and the Northern Territory recorded 20,146, 17,963, and 10,566 new vehicle sales, respectively.
What are the top-selling new vehicle brands in Australia?
Toyota remained Australia’s top-selling new vehicle brand in 2025, with 239,863 sales.
- Ford ranked second with 94,399 sales, followed by Mazda with 91,923.
- Kia and Hyundai completed the top five, with 82,105 and 77,208 sales, respectively.
- GWM and BYD both entered the top 10, with 52,809 and 52,415 new vehicle sales.
| Top-Selling New Vehicle Brands in Australia (2025) | |||
|---|---|---|---|
| Rank | Brand | 2025 Sales | Market Share |
| 1 | Toyota | 239,863 | 19.33% |
| 2 | Ford | 94,399 | 7.61% |
| 3 | Mazda | 91,923 | 7.41% |
| 4 | Kia | 82,105 | 6.62% |
| 5 | Hyundai | 77,208 | 6.22% |
| 6 | Mitsubishi | 61,198 | 4.93% |
| 7 | GWM | 52,809 | 4.26% |
| 8 | BYD | 52,415 | 4.22% |
| 9 | Isuzu Ute | 42,297 | 3.41% |
| 10 | MG | 41,298 | 3.33% |
Source · Note: The ranking is for new vehicle brands, not passenger-car-only manufacturers.
What are the most popular new vehicle models in Australia?
The Ford Ranger was Australia’s top-selling new vehicle model in 2025, with 56,555 sales.
- The Toyota RAV4 ranked second with 51,947 sales, followed closely by the Toyota HiLux with 51,297.
- The Isuzu Ute D-Max and Ford Everest completed the top five, with 26,839 and 26,161 sales.
- Toyota had three models in the top six: the RAV4, HiLux, and Prado.
| Top 10 Selling New Vehicle Models in Australia (2025) | |||
|---|---|---|---|
| Rank | Model | Manufacturer | 2025 Sales |
| 1 | Ford Ranger | Ford | 56,555 |
| 2 | Toyota RAV4 | Toyota | 51,947 |
| 3 | Toyota HiLux | Toyota | 51,297 |
| 4 | Isuzu Ute D-Max | Isuzu Ute | 26,839 |
| 5 | Ford Everest | Ford | 26,161 |
| 6 | Toyota Prado | Toyota | 26,106 |
| 7 | Hyundai Kona | Hyundai | 22,769 |
| 8 | Mazda CX-5 | Mazda | 22,742 |
| 9 | Mitsubishi Outlander | Mitsubishi | 22,459 |
| 10 | Tesla Model Y | Tesla | 22,239 |
Source · Note: The ranking is for new vehicle models, so it includes passenger vehicles, SUVs, and utes.
How does the Australian new vehicle market compare to global trends?
- SUVs accounted for 61% of Australia’s new vehicle sales in 2025, above the global SUV share of 48% reported by the International Energy Agency for 2023.
- Light commercial vehicles made up 22% of Australia’s 2025 new-vehicle market, reflecting the continued popularity of utes and work-oriented vehicles.
- Battery electric vehicles accounted for about 8.3% of Australia’s new vehicle sales in 2025, while electric cars made up more than 20% of new cars sold globally in 2024.
- Chinese brands became more visible in Australia’s top 10, with GWM and BYD recording 52,809 and 52,415 new vehicle sales in 2025.
What platforms are important for car sales in Australia?
- Australia’s online car classifieds market was valued at $570.1 million in 2025, up 8.8% from the previous year.
- Online listings remain important in the used-vehicle market, where AADA and AutoGrab track delisted private and dealer listings as used vehicle sales.
- Dealers accounted for 48.6% of used vehicle sales in 2025, up from 39.1% in 2024.
- Private sellers still represented a slight majority of used vehicle sales, accounting for 51.4% of the 2025 used market.
Note: Used vehicle sales are based on delisted private and dealer listings, so they should be read as a market activity proxy rather than a government registration count.
Economic impact of new car and truck dealers in Australia
- Australia’s new car and truck dealers generated $93.2 billion in annual sales turnover in 2025.
- Their total economic contribution was $20.9 billion annually.
- The sector employed 68,493 people, including 7,802 apprentices.
- Dealer wages totalled $8.3 billion annually.
- Dealers contributed $7.7 billion in tax and duty payments.
Note: Economic impact figures refer to Australia’s new car and truck dealers, not the entire vehicle sales market.