

 Australia
 New Zealand
 Other Countries
 24/7 Support
Updated
Ballina Byron Gateway Airport (BNK) is a key regional hub for the Byron Bay and Northern Rivers region of New South Wales, Australia, linking this popular destination to major Australian cities through domestic airline services.
How many passengers pass through Ballina Byron Gateway Airport each year?
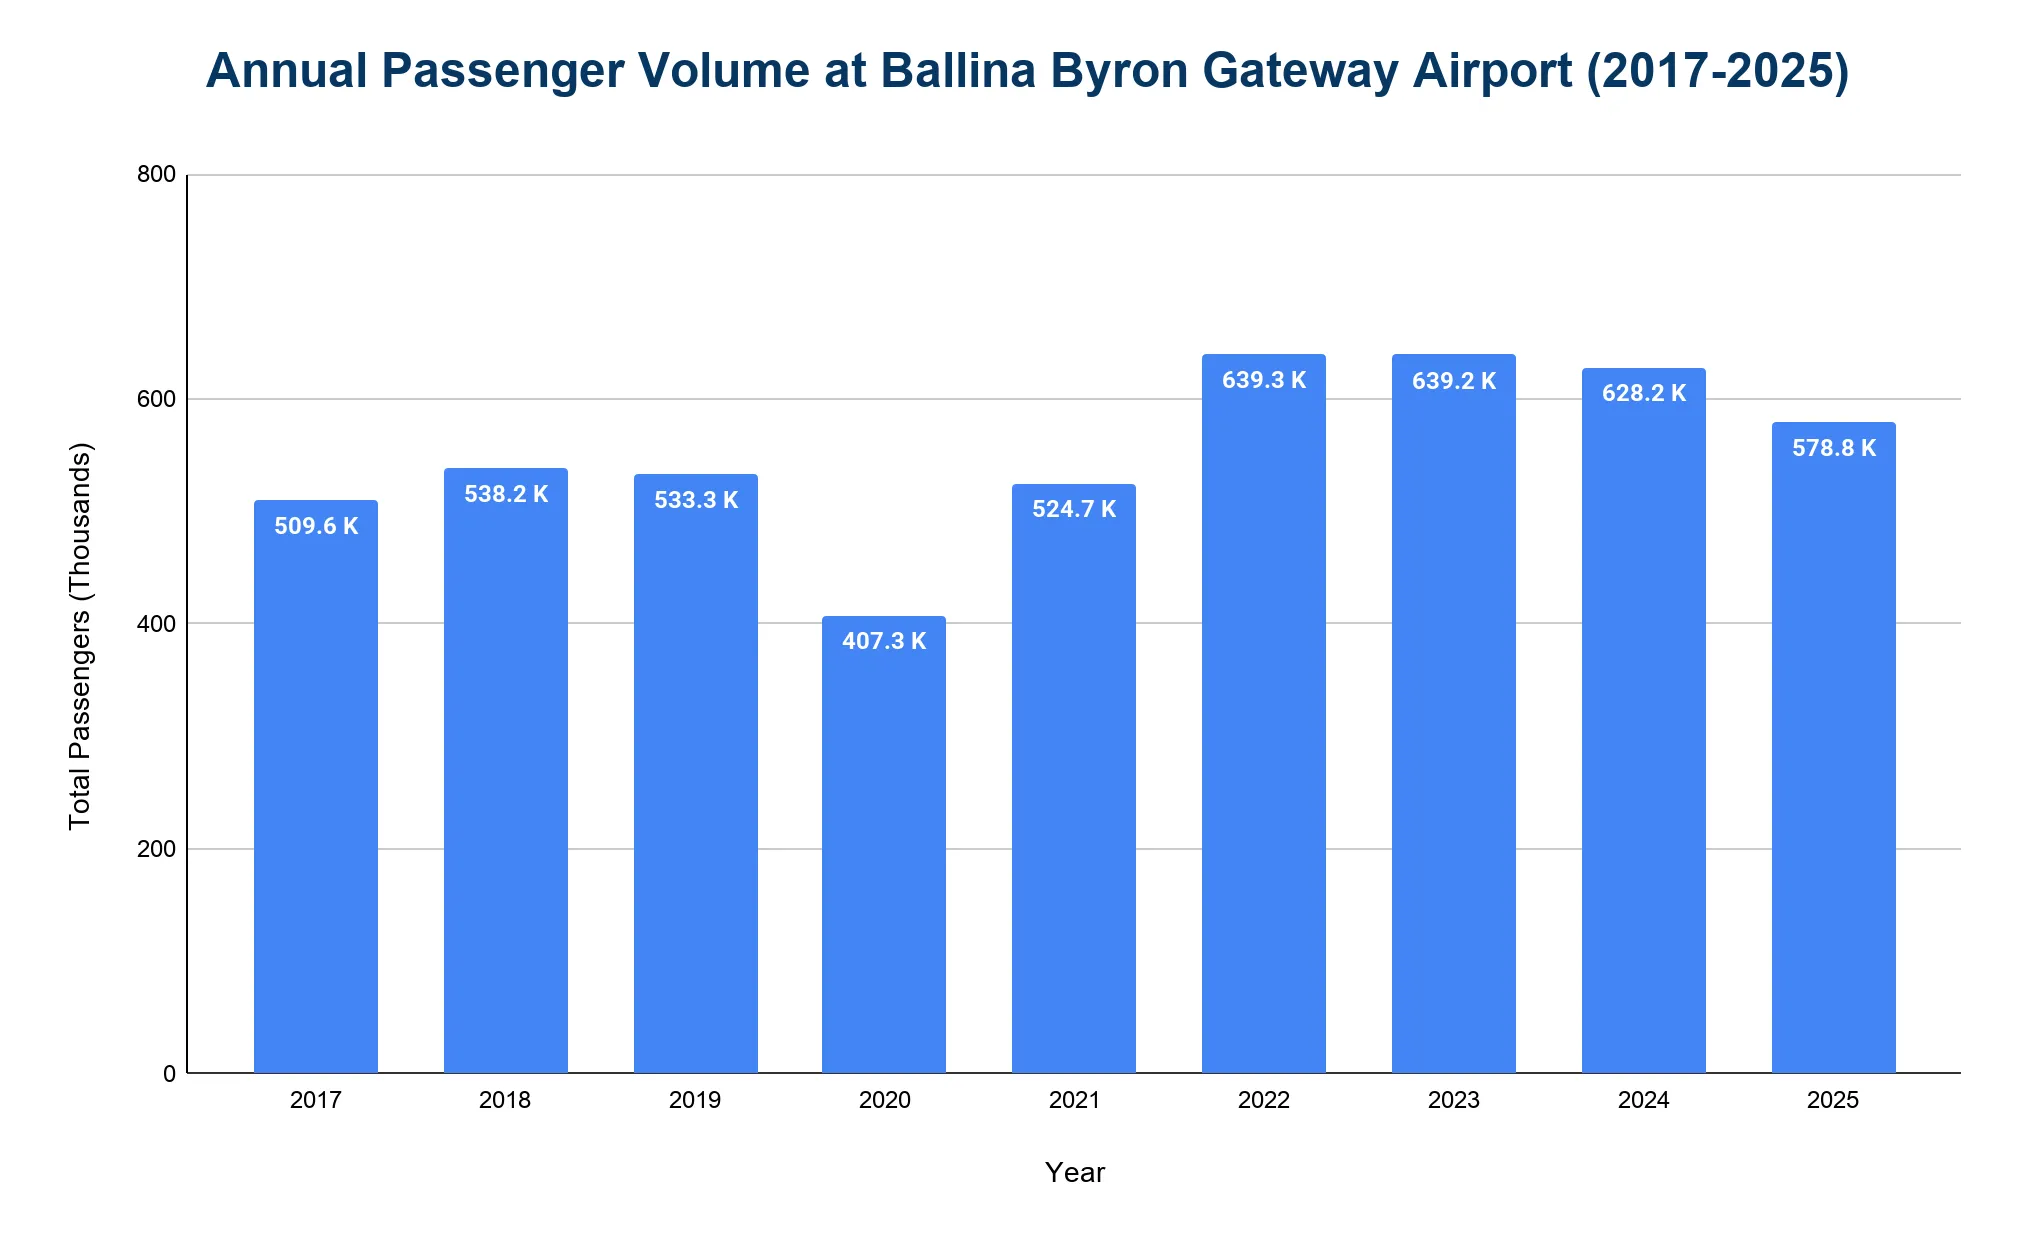
Ballina Byron Gateway Airport handles over 575,000 passengers annually, ranking among Australia's busiest regional airports.
- The airport served 578,803 passengers in 2025, representing a 7.9% decline from 628,220 in 2024.
- In 2019, prior to the pandemic, 533,279 passengers were recorded.
- Passenger traffic fell to 407,277 in 2020 (a 23.6% decline), then rebounded to 524,684 in 2021.
- In 2022, traffic rose to 639,313, followed closely by 639,180 in 2023.
What is the total number of aircraft operations at Ballina Byron Gateway Airport each year?
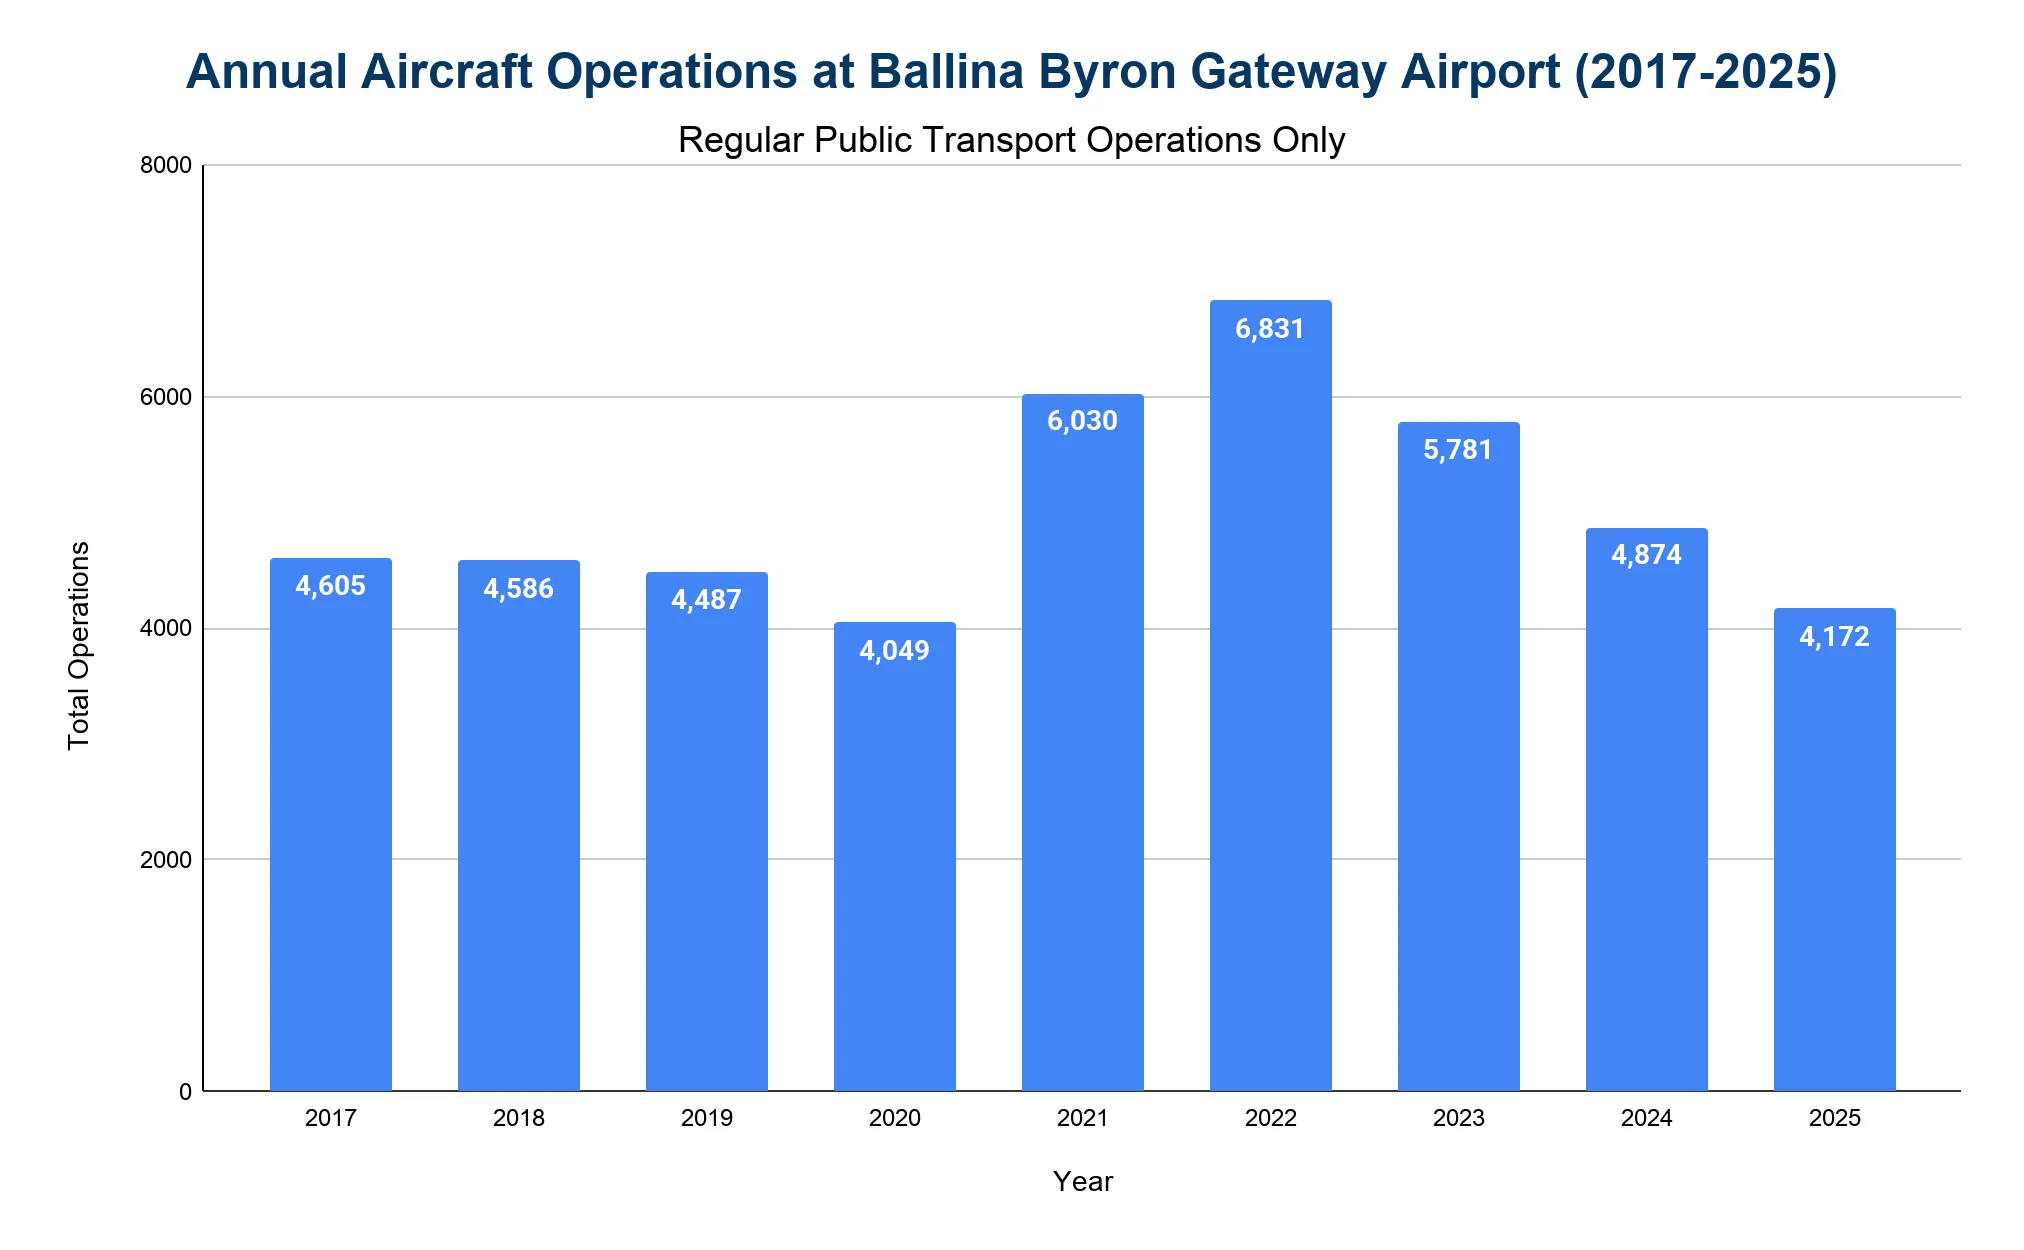
Ballina Byron Gateway Airport records around 4,000 to 7,000 commercial airline (Regular Public Transport, RPT) operations annually.
- In 2025, there were 4,172 aircraft movements, reflecting a 14.4% decrease from 4,874 movements in 2024.
- In 2019, pre-pandemic movements were around 4,487.
- Operations dipped slightly to 4,049 in 2020 during the early pandemic.
- A sharp rise followed in 2021 and 2022, with 6,030 and 6,831 total movements respectively, as domestic capacity expanded during internal border closures.
- Movements normalized in 2023 to about 5,781, as airlines consolidated schedules and operated larger aircraft.
What are the monthly trends in passenger traffic at Ballina Byron Gateway Airport?
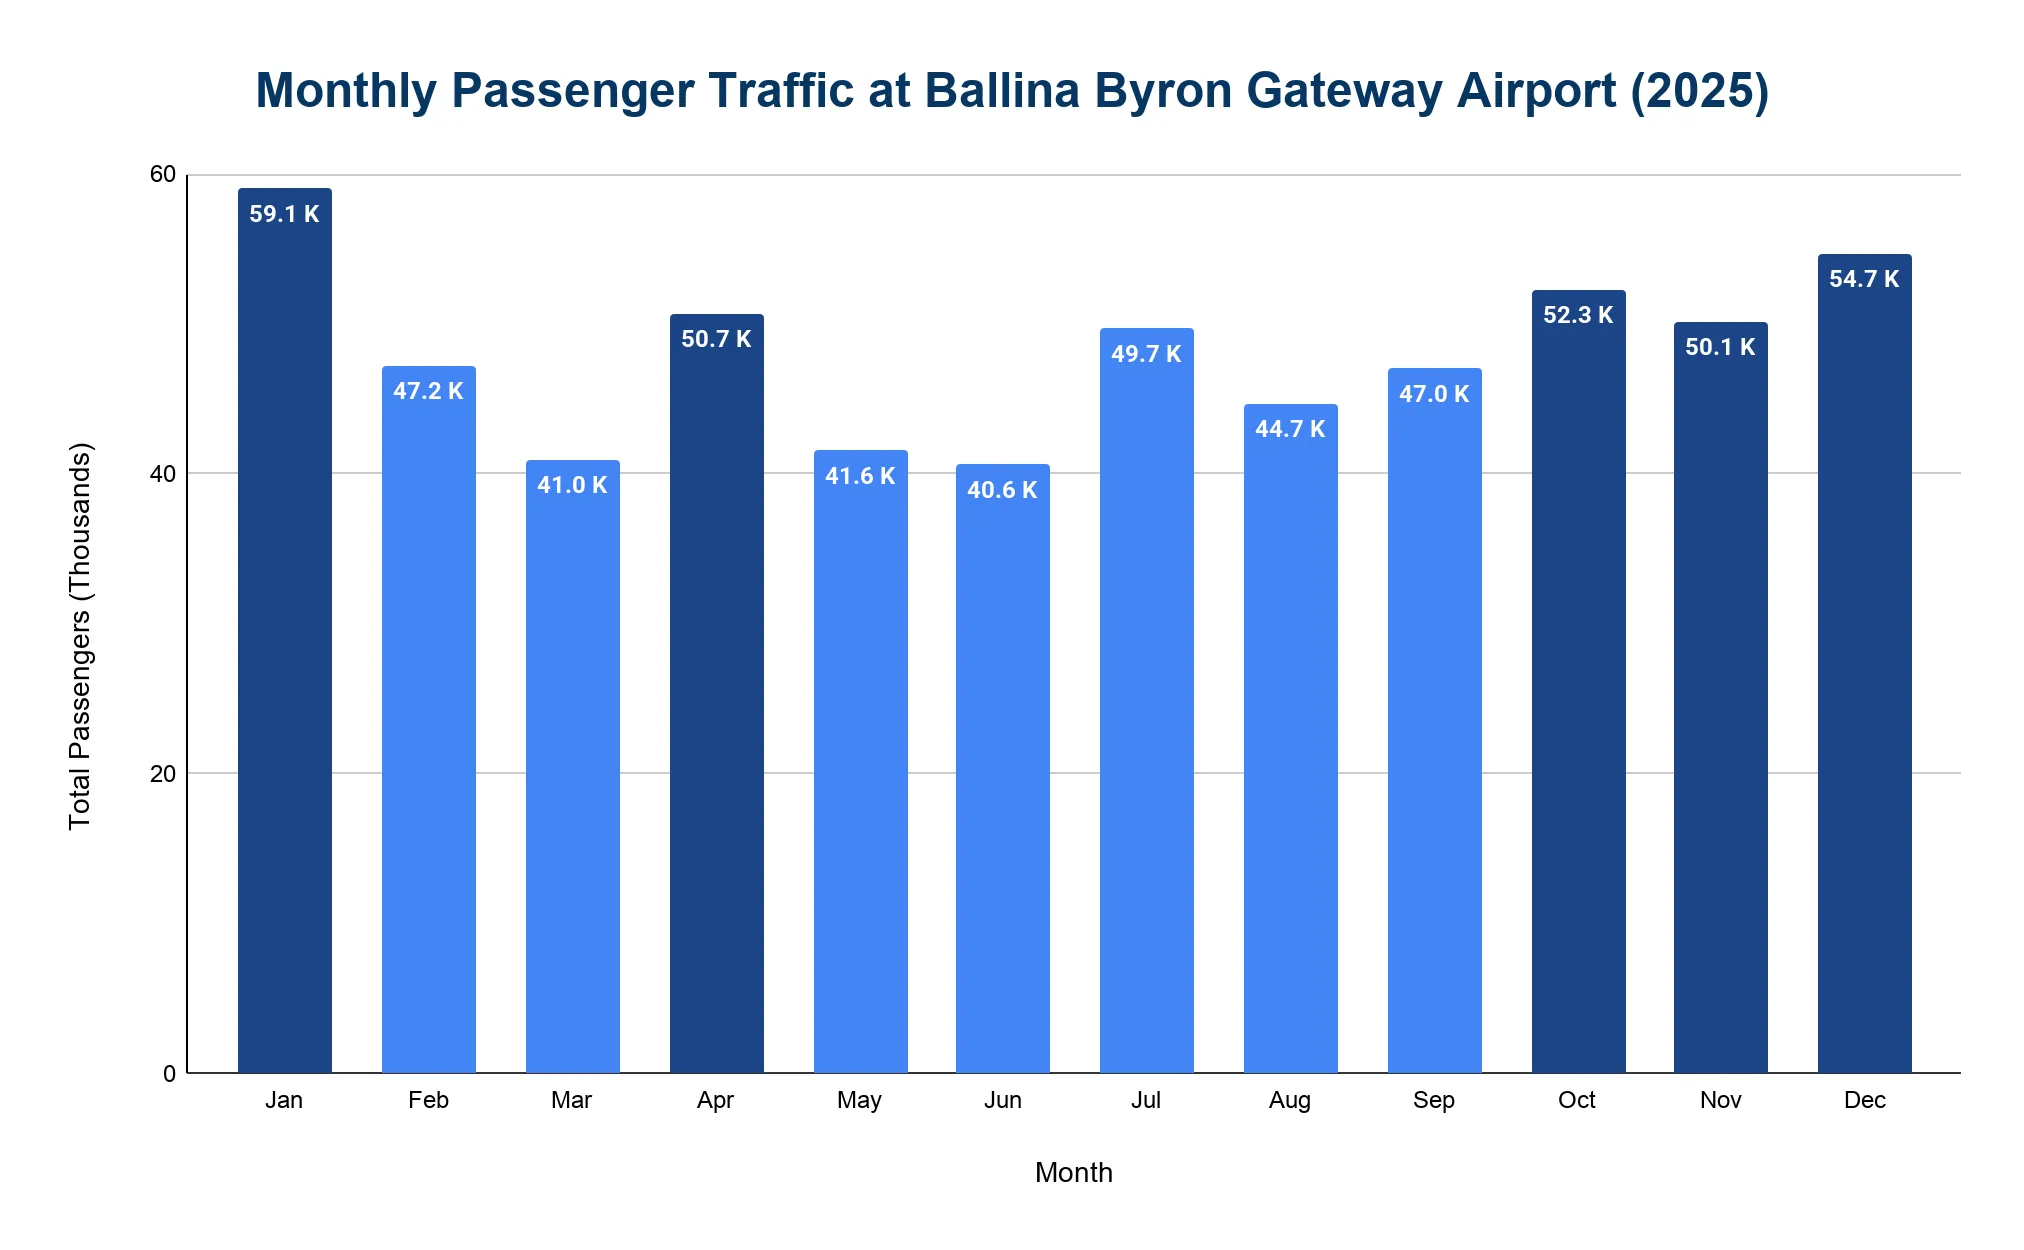
Ballina Byron Gateway Airport experiences strong seasonal trends, with peak traffic during summer and holiday periods.
- January was the busiest month in 2025, with 59,072 passengers.
- December followed closely with 54,692, and October had 52,334, showing robust spring and early summer demand.
- April handled 50,733, and November had 50,147, consistent with high-season travel.
- The lowest traffic was in June (40,648), followed by March (40,957), reflecting typical autumnal and winter slowdowns.
How many routes are there at Ballina Byron Gateway Airport?
The airport operates primarily two major domestic routes: Sydney and Melbourne, which make up nearly all commercial passenger traffic.
- The Sydney–Ballina route is dominant, with up to 45 weekly flights (6–7 daily) during peak periods from multiple airlines.
- The Melbourne–Ballina route is less frequent, with 8–14 weekly flights depending on the season, primarily operated by Jetstar.
- There are no regular international flights, making BNK a fully domestic airport.
- Short-lived trial routes to Newcastle and Canberra were operated in 2020–2021 by Virgin Australia and FlyPelican but were later discontinued.
- The network mainly supports leisure and visiting friends and relatives (VFR) travel, with Byron Bay tourism driving demand.
How much cargo does Ballina Byron Gateway Airport handle annually?
Ballina Byron Gateway Airport supports limited air cargo activity, with no dedicated freight services.
- All cargo is transported in the belly-hold of passenger aircraft, including mail, express parcels and occasional speciality items like seafood or medical supplies.
- There are no dedicated cargo facilities beyond standard baggage and freight handling areas at the terminal.
How many cancellations occur at Ballina Byron Gateway Airport annually?
Flight cancellations at BNK vary but remain relatively low under normal conditions.
- Typically, 1–2% of flights are cancelled each year, aligning with industry norms for regional airports.
- The highest cancellation rate occurred in 2020, due to pandemic disruptions and schedule cuts.
- In most months, cancellation rates stay below 2%, except during significant weather events or operational disruptions.
What are the main causes of flight disruptions at Ballina Byron Gateway Airport?
- Weather is the primary cause, especially morning fog and low cloud, which can delay or cancel flights.
- Upstream delays from Sydney, where most flights originate, also impact schedules at Ballina.
- Summer thunderstorms (November to February) can cause further disruptions.
- As an uncontrolled airport in Class G airspace, there are occasional communication issues, although the Certified Air/Ground Radio Service (CA/GRS) introduced in 2017 has improved operations.
- Aircraft rotation delays can have cascading effects, as a delayed inbound flight often impacts the next scheduled departure.
- Canberra Airport Statistics
- Devonport Airport Statistics
- Emerald Airport (YEML) Statistics
- Esperance Airport Statistics
- Hervey Bay Airport Statistics
- Kalgoorlie-Boulder Airport Statistics
- Karratha Airport Statistics
- Launceston Airport Statistics
- Merimbula Airport Statistics
- Newcastle Airport (Australia) Statistics
- Port Macquarie Airport Statistics
- Sunshine Coast Airport Statistics
What are the notable incidents at Ballina Byron Gateway Airport?
- 14 January 2016: A serious near-miss incident occurred when a Jetstar A320 on approach almost collided with a Beechcraft Duchess training aircraft in uncontrolled airspace. The Australian Transport Safety Bureau (ATSB) report highlighted the limits of the see-and-avoid system, leading to the implementation of the Certified Air/Ground Radio Service in 2017.
- March 2020: Regional Express (Rex) withdrew from BNK, citing competitive pressure from Qantas. While not a safety incident, this marked a shift in the airport’s airline dynamics.
References
- Australian Airports Traffic Data · bitre.gov.au
- Incident at Merimbula Airport · atsb.gov.au