

 Australia
 New Zealand
 Other Countries
 24/7 Support
Published
Australia’s car market continues to evolve, reflecting steady growth in passenger vehicle registrations and changing consumer preferences. Data from official sources reveals not only increasing fleet sizes, but also shifting trends in vehicle type and ownership patterns across urban and regional areas.
How many vehicles are there in Australia?
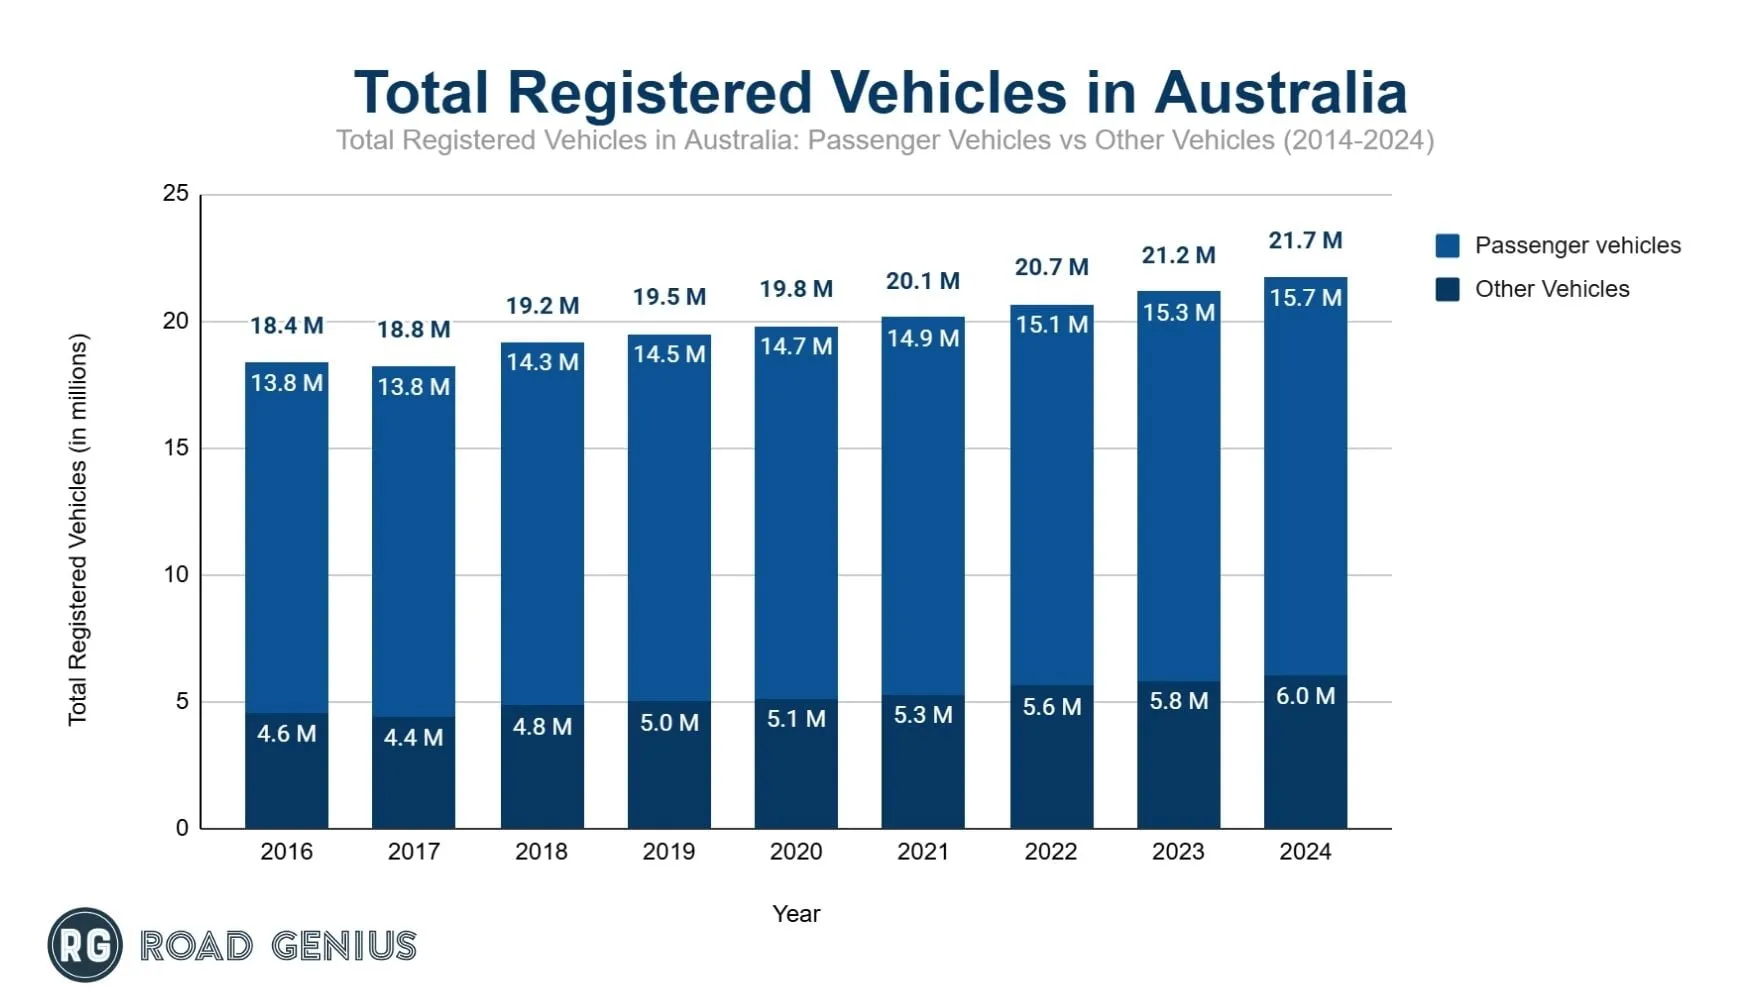
Over 21 million registered vehicles were recorded by 2024, with an annual growth of approximately 2.7%, a consistent expansion over time.
- From 2014 to 2024, total vehicle registrations increased by 23.3% (from 17.63 million to 21.73 million).
- The fastest annual growth was in 2022, when total registered vehicles increased by 2.6% following the post-pandemic recovery.
- In 2020, total vehicle registrations grew by 1.5%, despite the pandemic’s impact on travel and mobility.
- By 2024, Australia had nearly 2 million more vehicles than in 2020, a 9.7% increase over four years.
- Passenger vehicles remained the dominant category but decreased in percentage share from 75.41% in 2014 to 72.23% in 2024.
- Other vehicle registrations (including trucks, motorcycles, and buses) grew by 39.2% over the same period (from 4.33 million in 2014 to 6.03 million in 2024).
How many cars are registered in Australia?
As of 2024, 15.7 million passenger vehicles were registered in Australia, accounting for 72.2% of the total registered vehicles.
- Over the past 10 years (2014-2024), passenger vehicle registrations have increased by 2.4 million, grown by 18.1% from 2014 when 13.3 million passenger vehicles were registered. However, the percentage share of total registrations has dropped by 3.2%.
- In the last five years (2019-2024), passenger vehicle numbers grew by 8.2%, from 14.5 million to 15.7 million.
- The most recent year-on-year growth (2023-2024) saw an addition of 374,513 passenger vehicles to the Australian market, reflecting a 2.4% increase.
| Registered Vehicles Over the Years in Australia | ||||
|---|---|---|---|---|
| Year | Passenger vehicles | Other Vehicles | Total Registered Vehicles | Passenger Vehicles (%) |
| 2014 | 13,297,260 | 4,336,233 | 17,633,493 | 75.41% |
| 2015 | 13,711,000 | 4,297,000 | 18,008,000 | 76.14% |
| 2016 | 13,815,107 | 4,572,029 | 18,387,136 | 75.13% |
| 2017 | 14,355,000 | 4,426,000 | 18,781,000 | 76.43% |
| 2018 | 14,330,432 | 4,842,847 | 19,173,279 | 74.74% |
| 2019 | 14,504,148 | 5,001,093 | 19,505,241 | 74.36% |
| 2020 | 14,679,249 | 5,126,082 | 19,805,331 | 74.12% |
| 2021 | 14,850,675 | 5,292,267 | 20,142,942 | 73.73% |
| 2022 | 15,050,528 | 5,626,068 | 20,676,596 | 72.79% |
| 2023 | 15,325,339 | 5,832,397 | 21,157,736 | 72.43% |
| 2024 | 15,699,852 | 6,037,114 | 21,736,966 | 72.23% |
Which Australian state has the highest level of Car Ownership?
New South Wales had the highest number of registered vehicles in Australia at 6.30 million in 2024, a 2.4% increase from the previous year.
- Victoria followed with 5.51 million, rising 2.4%, while Queensland recorded 4.75 million, marking a 3.3% growth.
- New South Wales, Victoria and Queensland together accounted for nearly 76% of all registered vehicles in Australia.
- Other states also saw increases in vehicle registrations. Western Australia, South Australia, and the Australian Capital Territory (ACT) each recorded an increase of approximately 3% compared to the previous year.
| Registered Vehicles Across Australia (in millions) | |||
|---|---|---|---|
| State/Territory | 2024 | 2023 | 2022 |
| New South Wales | 6.30 | 6.15 | 6.05 |
| Victoria | 5.51 | 5.38 | 5.27 |
| Queensland | 4.75 | 4.60 | 4.46 |
| South Australia | 1.60 | 1.55 | 1.52 |
| Western Australia | 2.53 | 2.44 | 2.37 |
| Tasmania | 0.54 | 0.53 | 0.52 |
| Northern Territory | 0.17 | 0.17 | 0.16 |
| Australian Capital Territory | 0.34 | 0.33 | 0.32 |
| Australia(Total) | 21.74 | 21.16 | 20.68 |
Which Australian state has the lowest level of car ownership?
The Northern Territory had the lowest number of registered vehicles, 168,676, with no growth from 2023.
- It was followed by the Australian Capital Territory (ACT), which had 337,854 registered vehicles.
- Meanwhile, Tasmania recorded the lowest growth rate, increasing by 1.9% to 541,140 registered vehicles in 2024.
How many cars are there per household in Australia?
The average household in Australia owns 1.8 vehicles, indicating widespread car dependency (derived from Census data).
- Approximately 91% of households have at least one car, while about 55% own two or more vehicles. These percentages illustrate both the necessity of, and trend towards, multi-car households.
- Urban areas such as Sydney and Melbourne have lower per-household ownership compared to rural regions, where reliance on cars is higher due to limited public transport, with regional differences being driven by infrastructure and lifestyle needs.
How many new cars are sold in Australia each year?
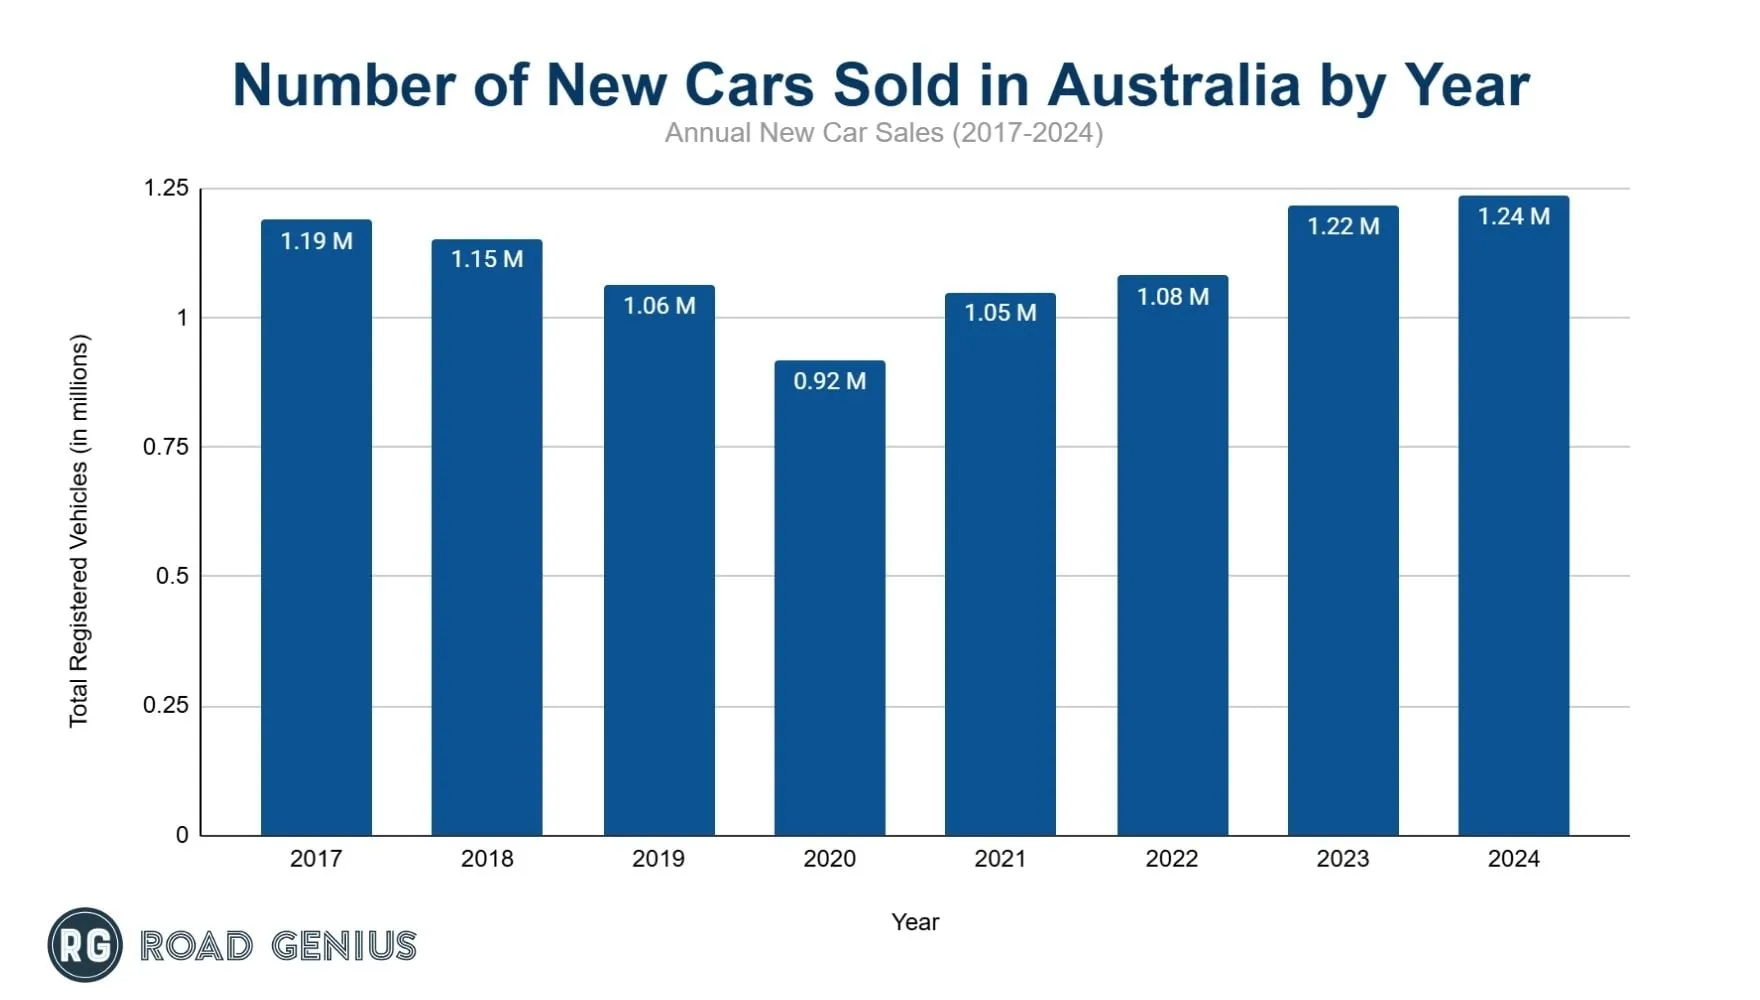
Record new car sales reached 1.22 million units in 2023 and 1.24 million units in 2024, following a 13.7% drop in 2020, reflecting a strong recovery post-pandemic.
- New car sales rebounded to over 1.05 million units in 2021, a 14.5% increase compared to 2020, when sales dropped to 916,968 units, reflecting recovery after the impact of the pandemic.
- A record 1,216,780 new vehicles were sold in 2023, marking a 12.5% rise over 2022, when sales were 1,081,429 units. This surge is attributed to clearing backlogs and renewed consumer demand.
- In 2024, new car sales further climbed to 1,237,287 units, representing an additional 1.7% increase from 2023, indicating market stabilization post-record highs.
- The used car market is roughly 1.7 times larger in volume than new car sales, a key insight into overall vehicle turnover.
Which car brands are the most popular in Australia?
Toyota remained the top-selling car brand in Australia in 2023, accounting for 17.81% of total sales with 215,240 units sold.
- Toyota’s 2023 position and total sold units represent a 1.4% increase from 212,090 units in 2022, and the brand has held the highest market share for over 21 years.
- The top 10 brands account for roughly 82% of the market, indicating that a few key players dominate sales.
- Chinese car brands have continued to expand in Australia. MG, for example, reached 4.83% market share with 58,346 units sold, increasing 6.6% from 2022. Haval and SAIC also gained market share, reflecting a rise in demand for these brands.
- Electric vehicle (EV) sales have grown, with Tesla reaching 3.82% market share, selling 46,116 units in 2023, a 107% increase from 22,256 units in 2022.
- Other brands in the top 10 include Isuzu (4.88%), Mitsubishi (5.26%), Subaru (3.82%), and Volkswagen (3.63%), all showing moderate growth in sales from the previous year.
| 2023 Top 20 Car Brands in Australia | |||
|---|---|---|---|
| Rank | Brand | Sale volume | Market Share |
| 1 | Toyota | 215,240 | 17.81% |
| 2 | Mazda | 100,008 | 8.28% |
| 3 | Ford | 87,800 | 7.27% |
| 4 | Kia | 76,120 | 6.30% |
| 5 | Hyundai | 75,502 | 6.25% |
| 6 | Mitsubishi | 63,511 | 5.26% |
| 7 | Isuzu | 58,999 | 4.88% |
| 8 | MG | 58,346 | 4.83% |
| 9 | Tesla | 46,116 | 3.82% |
| 10 | Subaru | 46,114 | 3.82% |
| 11 | Volkswagen | 43,821 | 3.63% |
| 12 | Nissan | 39,376 | 3.26% |
| 13 | Mercedes-Benz | 28,853 | 2.39% |
| 14 | BMW | 26,184 | 2.17% |
| 15 | Haval | 24,323 | 2.01% |
| 16 | SAIC | 21,298 | 1.76% |
| 17 | Audi | 19,039 | 1.58% |
| 18 | Suzuki | 17,078 | 1.41% |
| 19 | Lexus | 15,192 | 1.26% |
| 20 | Volvo | 14,680 | 1.21% |
What are the most popular car models in Australia?
The Ford Ranger led with 63,356 units sold in 2023, while the Toyota Hilux followed closely with 61,111 units. This rivalry reflects the national preference for utes and SUVs.
- The 2023 Top 10 list exclusively featured SUVs and utes, illustrating the shift away from traditional passenger sedans.
- In 2024, the Toyota RAV4 advanced to second place, and the Toyota Corolla re-entered the Top 10, indicating some recovery in the passenger car segment.
| 2023 Top 10 Car Model in Australia | ||
|---|---|---|
| Rank | Car Model | Sale volume |
| 1 | Ford Ranger | 63,356 |
| 2 | Toyota Hilux | 61,111 |
| 3 | Isuzu D-Max | 31,202 |
| 4 | Toyota RAV4 | 29,627 |
| 5 | MG ZS | 29,258 |
| 6 | Tesla Model Y | 28,769 |
| 7 | Toyota Land Cruiser | 26,449 |
| 8 | Mitsubishi Outlander | 24,263 |
| 9 | Mazda CX-5 | 23,083 |
| 10 | Hyundai Tucson | 21,224 |
Which car brands are most owned in Australia?
In 2024, Toyota remained the most owned car brand in Australia, with 3.16 million registered passenger vehicles, a 2.1% increase from 2023. Toyota continues to lead registrations due to its reliability and widespread dealership network.
- Mazda follows with 1.51 million registrations, up 2.96%, while Hyundai recorded 1.28 million, marking a 3.0% increase.
- Holden saw a decline, dropping to 1.19 million, reflecting its phased-out production. Ford also decreased by 4.2% to 900,461 vehicles.
- Among fast-growing brands, Tesla nearly doubled its registrations to 89,235, a 96.2% increase from 2023, reflecting the rising demand for electric vehicles (EVs). MG grew by 43.2% to 183,167 vehicles, showing strong market expansion.
- Luxury brands also grew, with Mercedes-Benz at 484,627 (+2.53%) and BMW at 404,258 (+3.57%).
| Passenger Vehicles on Register by Top 30 Brands | |||
|---|---|---|---|
| Brand | 2024 | 2023 | 2022 |
| Toyota | 3,161,779 | 3,097,326 | 3,029,092 |
| Mazda | 1,506,751 | 1,463,533 | 1,417,177 |
| Hyundai | 1,284,161 | 1,246,865 | 1,210,052 |
| Holden | 1,186,098 | 1,277,008 | 1,369,528 |
| Ford | 900,461 | 940,215 | 984,789 |
| Mitsubishi | 890,593 | 876,241 | 862,407 |
| Nissan | 817,122 | 815,860 | 827,654 |
| Subaru | 771,165 | 748,533 | 733,405 |
| Honda | 727,910 | 735,138 | 742,710 |
| Kia | 697,249 | 636,774 | 570,674 |
| Volkswagen | 594,290 | 576,412 | 567,013 |
| Mercedes-Benz | 484,627 | 472,691 | 456,339 |
| BMW | 404,258 | 390,267 | 379,304 |
| Suzuki | 332,850 | 325,594 | 313,103 |
| Audi | 264,029 | 251,755 | 242,346 |
| MG | 183,167 | 127,917 | 80,960 |
| Jeep | 176,256 | 178,593 | 178,528 |
| Lexus | 158,476 | 145,154 | 140,149 |
| Land Rover | 149,784 | 144,801 | 143,926 |
| Volvo | 114,832 | 107,235 | 99,497 |
| Tesla | 89,235 | 45,501 | 22,256 |
| Isuzu | 86,502 | 72,300 | 61,672 |
| Skoda | 71,673 | 65,060 | 59,049 |
| Renault | 66,776 | 64,199 | 60,754 |
| Porsche | 65,529 | 59,885 | 54,722 |
| Peugeot | 63,618 | 67,316 | 71,046 |
| Haval | 59,512 | 35,472 | 17,665 |
| MINI | 53,168 | 49,750 | 47,339 |
| Jaguar | 35,199 | 35,405 | 35,554 |
| Chrysler | 27,701 | 29,288 | 30,882 |
| Others | 275,081 | 243,251 | 240,936 |
How many electric vehicles (EVs) are registered in Australia?
There are over 159,000 registered EVs as of 2024, representing about 1% of the total fleet. This is a rapid increase from earlier years, indicating accelerated adoption.
- The EV fleet doubled from approximately 72,000 in 2023, driven by growing consumer interest and government incentives, and reflecting strong momentum in the EV sector.
- EVs comprised 7.2% of new car sales in 2023 and 7.4% in 2024, suggesting a steady rise in EV market penetration.
- Tesla remains dominant, with the Model 3 and Model Y leading EV sales, highlighting Tesla’s strong market presence in Australia.
| Registered Electric Vehicles (EV) in Australia | |||
|---|---|---|---|
| Brand | 2024 | 2023 | 2022 |
| Tesla | 89,235 | 45,501 | 22,256 |
| BYD | 16,013 | 2,478 | 27 |
| MG | 8,908 | 2,847 | 1,480 |
| Hyundai | 7,782 | 5,259 | 2,939 |
| Volvo | 5,880 | 1,959 | 238 |
| Mercedes-Benz | 5,380 | 2,179 | 1,075 |
| BMW | 5,013 | 1,871 | 534 |
| Kia | 4,495 | 1,243 | 271 |
| Nissan | 4,379 | 3,358 | 2,516 |
| Polestar | 4,093 | 1,721 | 34 |
| Others | 8,280 | 3,815 | 2,407 |
| Total | 159,458 | 72,231 | 33,777 |
How much does it cost to own a car in Australia?
A two-car household in capital cities spends an average of AU$24,262 per year, while in regional areas the expenditure averages AU$20,404 per year, with cost estimates reflecting comprehensive expenses including fuel, insurance, and maintenance.
- Key expenses include:
- Fuel: Approximately AU$50-AU$70 per week, totaling over AU$2,000 annually (prices based on average fuel costs and typical usage).
- Insurance: Around AU$1,300-AU$1,400 per year per vehicle, with premium estimates vary by driver and vehicle.
- Registration: Fees range between AU$700-AU$1,000 per year per car, with state-specific registration costs applying.
- Maintenance: Estimated at AU$800-AU$1,000 per year per vehicle, which reflects typical servicing and minor repair costs.
- Depreciation: New cars typically lose about 50% of their value within the first 3-5 years. This significant decline impacts long-term ownership costs.
- Average new car prices have increased by 42.5% over the last decade, with price hikes influenced by higher technology and model shifts toward SUVs/utes.
More Statistics
How long do Australians keep their cars?
The average age of vehicles in Australia is 11.2 years as of 2024, up from 10.6 years in 2021, indicating a trend toward longer usage periods.
- New car owners typically keep their vehicles for 5-7 years, while many second owners extend usage for 5+ years. Longer ownership helps offset high new car costs.
- Approximately 11% of vehicles are over 20 years old, whereas 25% are under 5 years old. This distribution highlights both longevity and turnover in the fleet.
- Factors influencing longer ownership include improved reliability, high new car prices, and economic considerations.
*Note: Estimations are based on observed trends in vehicle longevity and market behavior.*
How many Australians lease vs buy their cars?
Most Australians buy rather than lease their vehicles, and about 14% currently have a car loan, indicating that financing is common even among buyers.
- Leasing, primarily through novated leases, represents under 10% of new car transactions. Novated leases are popular among corporate employees due to tax advantages.
- EV novated leases are growing, with EVs accounting for 35-40% of these orders. The increase is driven by government incentives and favorable tax treatment.
References
- ABS Building Activity, Dec 2025 · Australian Bureau of Statistics
- FCAI: New Vehicle Market and Fuel Type Data (2025) · fcai.com.au
- BITRE: Domestic Aviation Activity (2019, 2024-2025) · bitre.gov.au
- NALSPA: Novated Lease Data — leasing trends in Australia · nalspa.com.au