

 Australia
 New Zealand
 Other Countries
 24/7 Support
Updated
Canberra is Australia's capital city, located in the Australian Capital Territory (ACT). Known for its national institutions and designed landscape, Canberra's tourism sector has evolved over the past decades from primarily government-focused to an increasingly leisure destination.
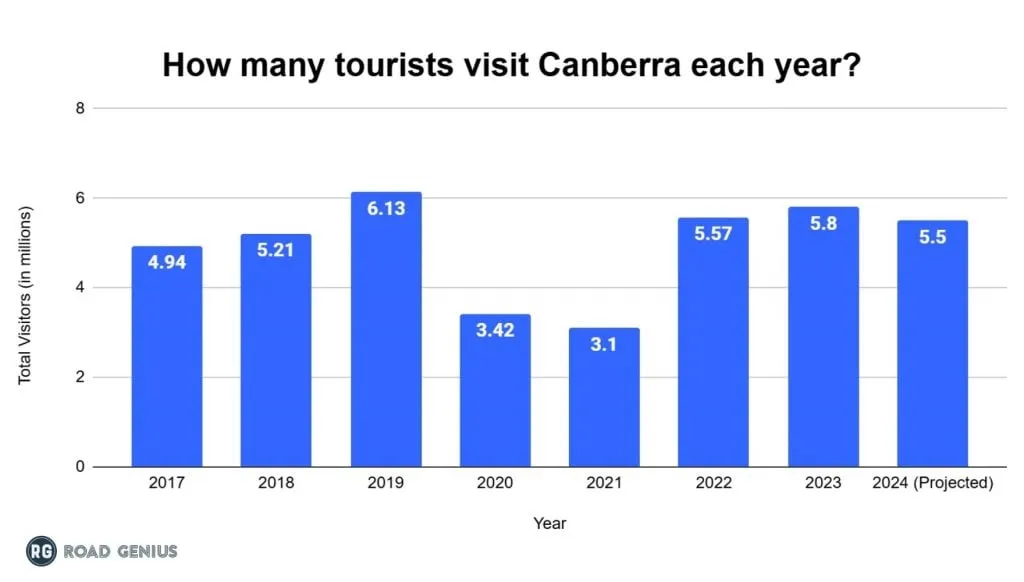
How many tourists visit Canberra each year?
Over 3 million tourists visit Canberra each year.
- Over 3.47 million total tourists visited Canberra in 2019, marking a pre-pandemic peak.
- Visitor numbers dropped during the pandemic years of 2020 to 2021, with recovery beginning in 2022 as arrivals increased to 3.12 million and continued growing through 2023 with 3.48 million visitors.
- Canberra recorded approximately 3.32 million overall visitors in 2024, representing a decrease from 2023 but maintaining strong recovery levels.
How many tourists visited Canberra in 2024?
Canberra welcomed 3.32 million overall visitors in 2024.
- In 2024, domestic tourists accounted for approximately 93% (3.10 million), while international visitors comprised approximately 7% (0.215 million) of the total arrivals in Canberra.
- This represents an approximately 5% decrease from 2023 and stands approximately 4% below the 2019 pre-pandemic peak, indicating continued recovery with some fluctuation.
How many tourists visited Canberra in 2023?
Canberra welcomed 3.48 million overall visitors in 2023.
- In 2023, domestic tourists accounted for approximately 95% (3.30 million), while international visitors comprised approximately 5% (0.179 million) of the total arrivals in Canberra.
- This represents an approximately 12% increase from 2022 and stands just approximately 1% above the 2019 pre-pandemic peak, confirming Canberra's near-complete tourism recovery.
How many tourists visited Canberra in 2022?
Canberra recorded 5.57 million visitors in 2022, an 80% increase from 2021. This jump was fueled almost entirely by domestic Australian travelers.
- The 2022 figures represented a near doubling from the pandemic-era low of 2021, though they remained about 9% below the pre-pandemic record set in 2019.
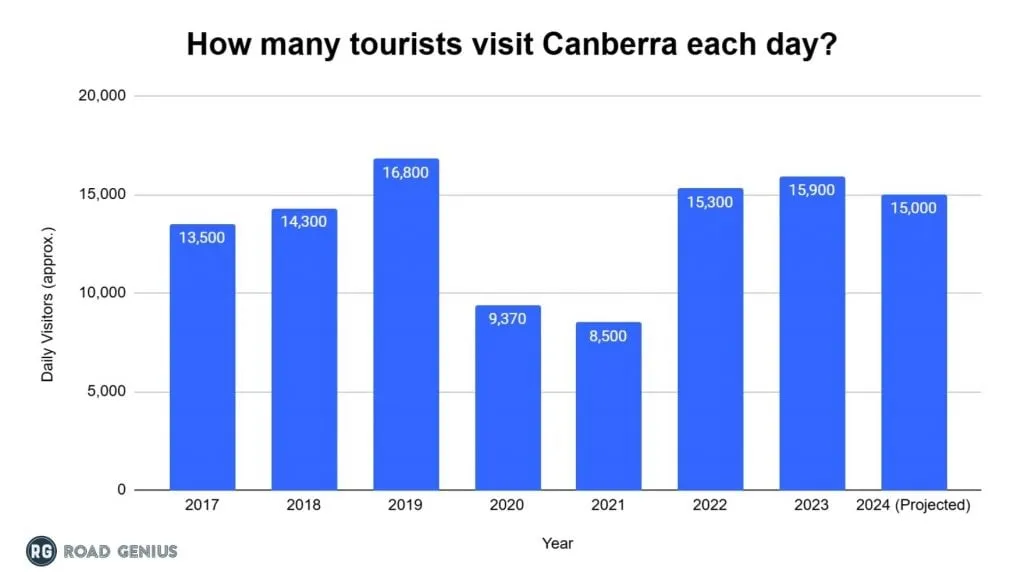
How many tourists visit Canberra each day?
- Canberra welcomes an average of 9,100 visitors daily in 2024, approaching the pre-pandemic peak of 9,500 daily visitors recorded in 2019 and representing a strong recovery from the pandemic low of 4,700 daily visitors in 2020.
How much do tourists spend in Canberra each year?
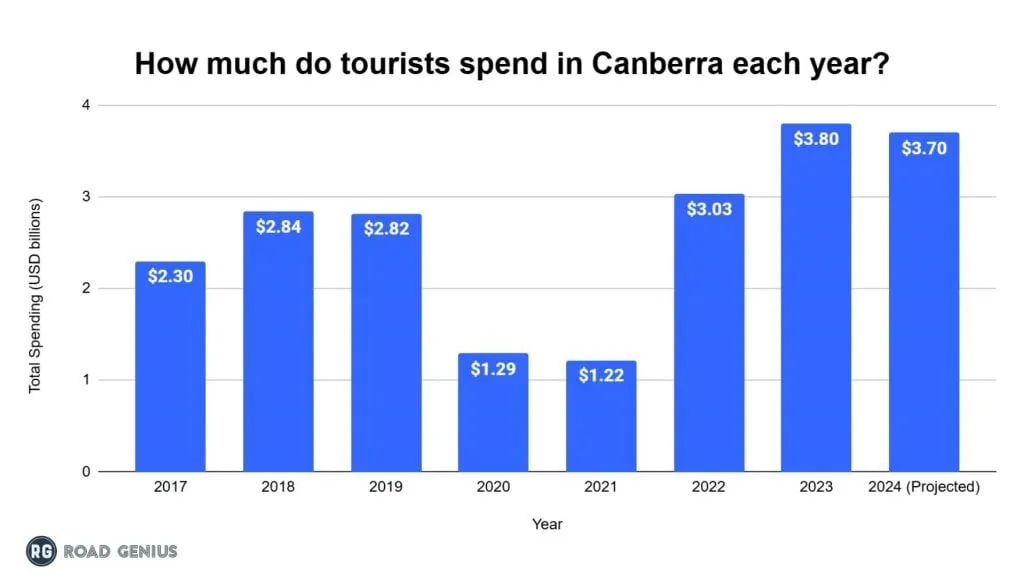
Tourists spend over AUD 3.2 billion in Canberra each year.
- Tourism revenue reached AUD 2.43 billion before the pandemic in 2019.
- A 55% decline followed, bringing revenue down to AUD 1.09 billion in 2020 due to COVID-19 restrictions.
- Early signs of recovery emerged as revenue increased by 12% to AUD 1.22 billion in 2021, though still 50% below 2019 levels.
- A strong rebound pushed revenue up by 104% to AUD 2.49 billion in 2022, surpassing pre-pandemic levels by approximately 3%.
- Continued growth led to a 24% increase, reaching AUD 3.09 billion in 2023, maintaining a 27% lead over 2019.
- Steady momentum brought revenue up by 3% from 2023 to AUD 3.19 billion in 2024, standing 31% higher than 2019 levels.
How much did tourists spend in Canberra in 2024?
Total tourist spending reached AUD 3.19 billion in Canberra in 2024, a 3% increase from 2023.
- Domestic tourists contributed AUD 2.56 billion, while international visitors spent AUD 0.63 billion in 2024.
How much did tourists spend in Canberra in 2023?
Total spending reached AUD 3.09 billion in Canberra in 2023, up 24% from 2022.
- Domestic visitors accounted for AUD 2.60 billion, and international tourists spent AUD 0.49 billion in 2023.
How much did tourists spend in Canberra in 2022?
Tourist expenditure was $3.03 billion in 2022, a more than double surge from $1.22 billion in 2021 and $1.29 billion in 2020.
- The strong 2022 spending was driven by domestic tourists, with locals compensating for the reduced number of international travelers as travel restrictions eased.
How much does it cost to visit Canberra?
All visitors spent an average of AUD 962 per trip in 2024, reflecting AUD 128 per day across an average stay of 7.5 nights.
- Domestic Visitors: Average spend of approximately AUD 826 per trip in 2024, with an average stay of 2.4 nights (about AUD 344 per day).
- International Visitors: Average spend of approximately AUD 2,930 per trip in 2024, with an average stay of 25 nights (about AUD 117 per day).
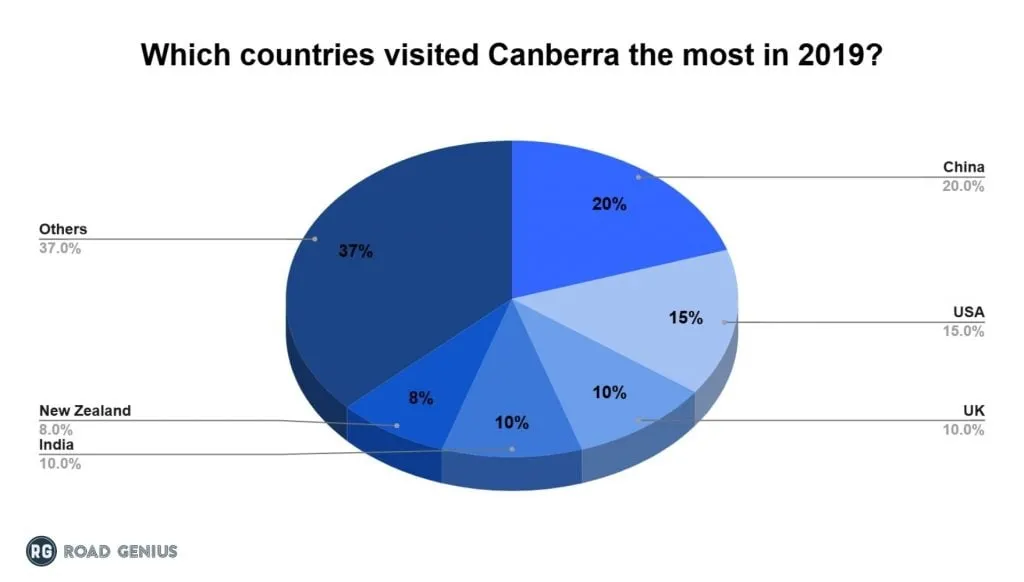
Which countries visited Canberra the most?
China accounts for the largest share of international visitors, comprising 18% of the total in 2024.
- Other key source markets include the United States (12%), New Zealand (10%), the United Kingdom (8%), India (6%), and Other Countries (46%) in 2024.
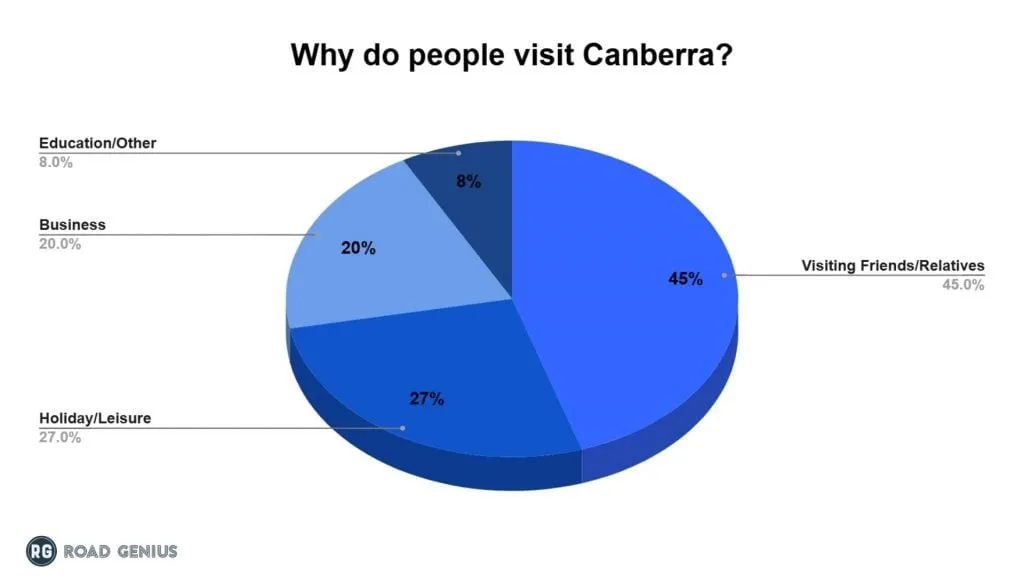
Why do people visit Canberra?
- Visiting Friends and Relatives: A significant 50% of tourists visit friends and family in 2024, mainly from mainland Australia.
- Leisure Travel: 30% of visitors engage in leisure travel in 2024, enjoying Canberra's national institutions, cultural attractions, and events.
- Business Purposes: Business travelers make up 17% in 2024, attending government meetings, conferences, and professional engagements.
- Education and Other: Education and other purposes account for 3% of visitors in 2024.
How popular is Canberra as a tourist destination?
Canberra has gained the rank #3 among the world's top 10 cities to visit in Lonely Planet's prestigious Best in Travel 2018 rankings, the highest ranking ever achieved by an Australian city.
- The ACT tourism industry received a record seven awards at the 2023 Australian Tourism Awards, including three Gold awards.
- Canberra has transformed its image from just a "boring capital" to being known for its "cool" factor, vibrant short-break destination, and quality experiences.
- Events like Floriade, Enlighten, and the National Multicultural Festival have become internationally recognized attractions.
When is the best time to visit Canberra?
Canberra is a year-round destination, but September through November (spring) and March through May (autumn) offer the best balance of pleasant weather, fewer crowds, and exciting events.
- Spring (Sep-Nov) features mild weather (10-25°C), blooming wildflowers, and events like Floriade, Australia's biggest spring flower festival, while summer (Dec-Feb) brings peak tourist season with warm sunny weather (15-35°C) perfect for outdoor activities and school holiday visits.
- Autumn (Mar-May) offers crisp, clear days ideal for exploring national institutions and cultural sites, often coinciding with events like Enlighten Festival, while winter (Jun-Aug) provides cooler temperatures (5-11°C) perfect for museums, indoor attractions, and fewer crowds.
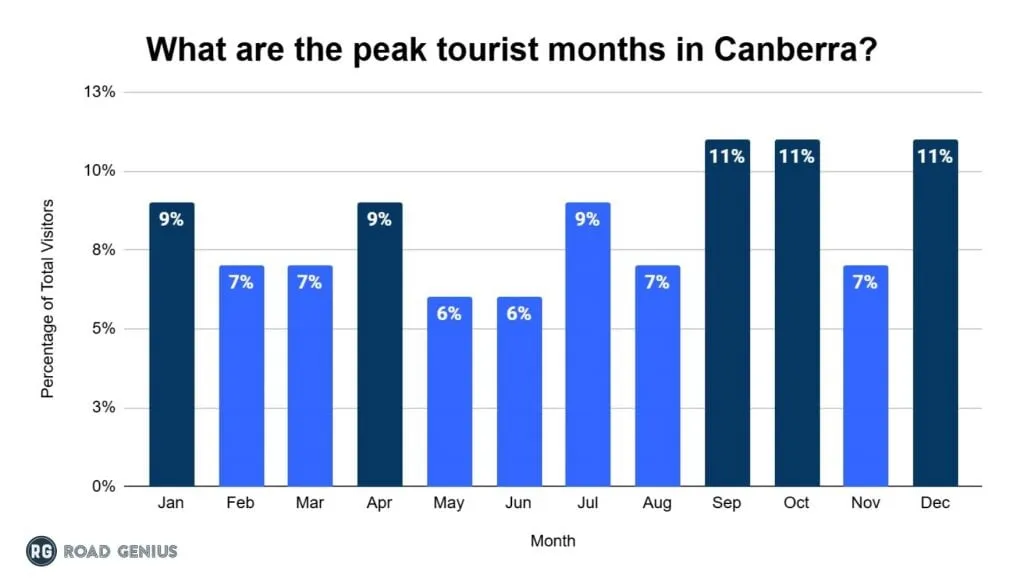
What are the peak tourist months in Canberra?
September, October, and December are the peak tourist months in Canberra tourism in 2023.
- September, October, and December are the busiest months, each accounting for 11% of total visitors in Canberra.
- January and April each account for 9% of annual visitors in Canberra.
How long do visitors stay in Canberra?
The average length of stay for all visitors is about 7.5 nights in 2024.
- The average length of stay for international visitors is approximately 25 nights in 2024.
- For domestic visitors, particularly interstate overnight visitors, the average length of stay has returned to around 2.4 nights in 2024.
Outbound Tourism Statistics for Canberra
- Canberrans are avid travelers with outbound international trips estimated at 250,000+ in 2019 (pre-pandemic).
- Outbound travel dropped by more than 95% in 2020-21 due to border closures and travel restrictions.
- By late 2023, ACT resident outbound travel had rebounded to approximately 80-90% of pre-pandemic levels.
- Canberra Airport lost international flights during the pandemic but has gradually regained connections, with services to Singapore, Fiji, and other destinations resuming.
- In 2023, international visitor arrivals to the ACT (which includes returning residents) were at 86% of 2019 levels, the highest recovery rate of any Australian state.
Economic Impact - Canberra Tourism Statistics 2024
- Canberra's tourism revenue reached approximately AUD 3.19 billion in 2024.
- The tourism sector supports approximately 16,800 jobs and contributes around 5-6% to the ACT's Gross State Product (GSP).
- Tourism revenue increased by approximately 3% compared to 2023, confirming continued recovery.
Impact of COVID-19 on Canberra Tourism (2020-2021)
- Total visitors dropped to approximately 1.70 million in 2020, a decline of 51% from the pre-pandemic peak of 3.47 million in 2019.
- Numbers increased to around 1.74 million in 2021, marking the start of recovery.
- Visitor spending declined to AUD 1.09 billion in 2020, a decrease of 55% from AUD 2.43 billion in 2019.
- Spending began to recover in 2021, reaching AUD 1.22 billion, up 12% from 2020.
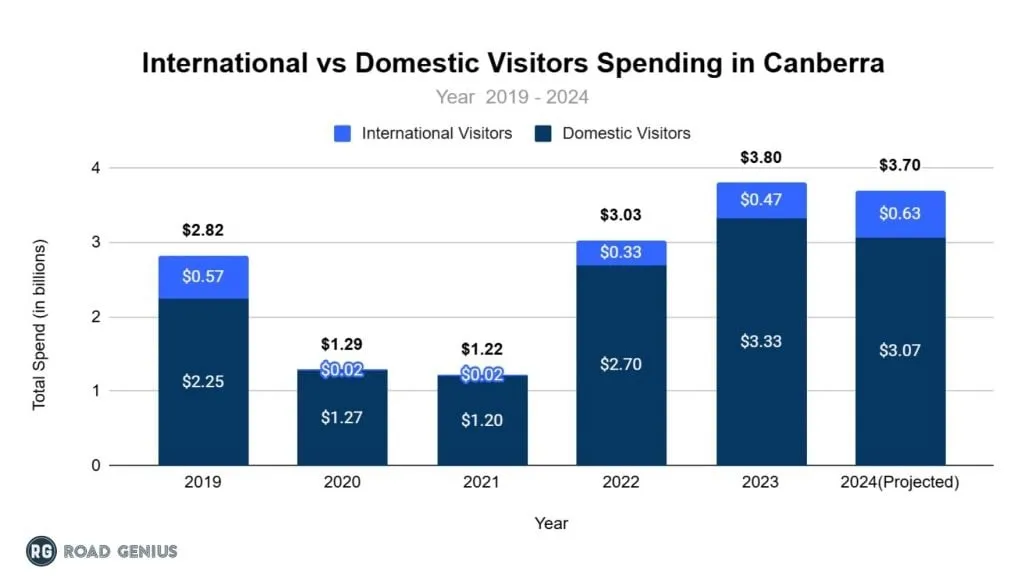
International vs Domestic Visitors Spending in Canberra
- A total of AUD 2.43 billion in tourism spending was recorded in 2019, with approximately AUD 0.57 billion (about 23%) coming from international visitors and AUD 1.86 billion (about 77%) from domestic travelers.
- An overall AUD 1.09 billion was spent in 2020, including about AUD 0.11 billion (about 10%) from international visitors and AUD 0.98 billion (about 90%) from domestic tourists.
- Around AUD 1.22 billion was spent in 2021, with approximately AUD 0.22 billion (about 18%) from abroad and AUD 1.00 billion (about 82%) from within Australia.
- A total of AUD 2.49 billion was spent in 2022, comprising about AUD 0.25 billion (around 10%) international and AUD 2.24 billion (around 90%) domestic.
- About AUD 3.09 billion in tourism revenue was generated in 2023, with AUD 0.49 billion (about 16%) coming from international visitors and AUD 2.60 billion (about 84%) from domestic travelers.
- Approximately AUD 3.19 billion in tourism spending was recorded in 2024, with AUD 0.63 billion (about 20%) coming from overseas visitors and AUD 2.56 billion (about 80%) from within Australia.
Unique Festivals and Events in Canberra
- Floriade: Australia's largest flower festival attracts over 400,000 visitors each year (433,271 in 2023), generating approximately $35-40 million in economic impact annually.
- National Multicultural Festival: Broke records in 2023 with 380,563 total attendances over three days (273,965 unique attendees), with an economic impact estimated at $20.8 million.
- Enlighten Festival: Attracts about 115,000 attendees over its run, with light installations projected onto national buildings at night.
- Summernats: Car festival drawing 130,000 attendees over four days in 2024, a record attendance.
- Canberra Balloon Spectacular: Launches approximately 25 hot air balloons at dawn each day for a week in March, attracting tens of thousands of spectators.
Unique Markets and Bazaars to Visit in Canberra
- Old Bus Depot Markets: Houses over 200 vendors weekly, attracting approximately 5,000 visitors each Sunday, with tourists accounting for about 35% of all customers.
- Capital Region Farmers Market: Features 100+ producers every Saturday, drawing approximately 5,000 visitors weekly and generating an estimated annual revenue of $15 million, with over 300,000 annual visitors.
- Handmade Market: Showcases 270 independent designers quarterly, bringing in 20,000+ shoppers over a weekend, with an average transaction value of $85 per customer and an estimated $1.7 million in sales per event.
- Christmas markets and Enlighten Night Noodle Markets: The Night Noodle Markets feature 25 food stalls over 10 nights during the Enlighten Festival, attracting approximately 30,000 visitors with an average spend of $45 per person.
- Adelaide Tourism Statistics
- Bondi Beach Tourism Statistics
- Brisbane Tourism Statistics
- Gold Coast Tourism Statistics
- Great Barrier Reef Tourism Statistics
- Melbourne Tourism Statistics
- Noosa Tourism Statistics
- Perth Tourism Statistics
- Sunshine Coast Tourism Statistics
- Sydney Harbour Bridge Tourism Statistics
- Sydney Opera House Tourism Statistics
- Uluru Tourism Statistics
What to visit in Canberra?
- Australian War Memorial: The most visited attraction, with close to 900,000 visitors annually.
- National Institutions: Parliament House, National Gallery of Australia, National Museum of Australia, and Questacon (which had a record 514,000 visitors in 2018-19).
- Floriade: The month-long spring flower festival in Commonwealth Park draws over 400,000 attendees annually.
- Other: Lake Burley Griffin, Mount Ainslie Lookout.
References
- Tourism Spending Statistics - The Great Barrier Reef · Tourism Research Australia
- Canberra Tourism Statistics · tourism.act.gov.au
- Visitors Spending in Canberra · cmtedd.act.gov.au
- Peak Time to Visit Canberra · whereandwhen.net