

 Australia
 New Zealand
 Other Countries
 24/7 Support
Updated
Uluru, also known as Ayers Rock, is renowned for its cultural significance to the Anangu people and its popularity as a UNESCO World Heritage site. It attracts tourists for its stunning sunrises, sunsets, and Indigenous heritage experiences.
How many people visit Uluru each year?
Over 250,000 tourists typically visit Uluru each year.
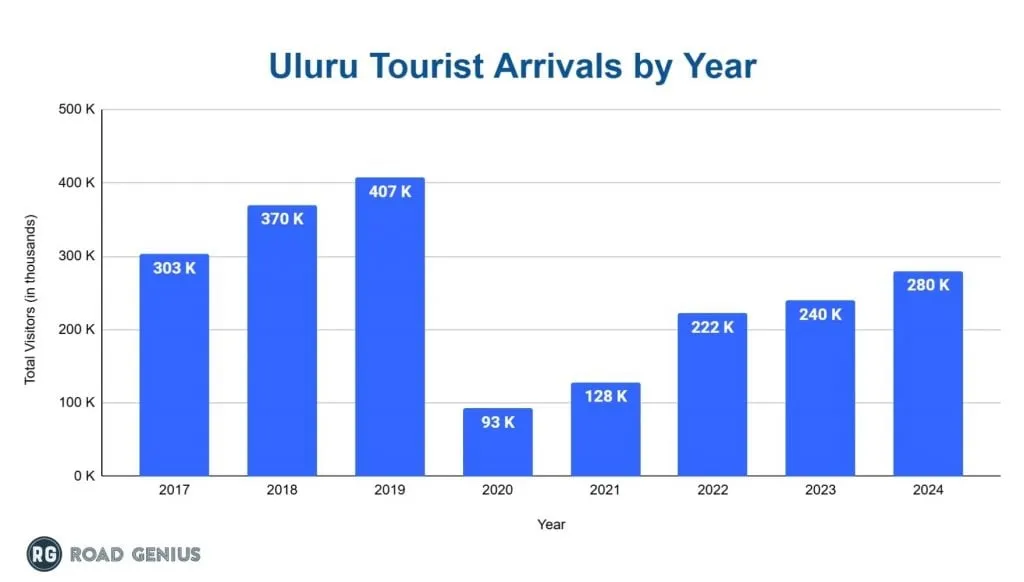
- Before the pandemic, visitor numbers peaked at approximately 407,000 in 2019, while in 2023, the destination recorded 240,000 visitors, about 59% of pre-pandemic levels.
- Uluru received 280,000 total visitors in 2024, about 69% of the pre-pandemic peak.
How many tourists visited Uluru in 2024?
Over 280,000 tourists visited Uluru in 2024.
- Domestic tourists accounted for 70% (196,000), while international visitors comprised 30% (84,000) of total arrivals in Uluru in 2024.
How many tourists visited Uluru in 2023?
- Over 240,000 tourists visited Uluru in 2023. Domestic tourists accounted for 75% (180,000), while international visitors comprised 25% (60,000) of total arrivals in Uluru in 2023.
How many tourists visit Uluru each day?
- Uluru welcomed an average of approximately 767 visitors daily in 2024, still below the pre-pandemic peak of approximately 1,115 daily visitors recorded in 2019.
How much do tourists spend in Uluru every year?
Tourists spend over AUD 320 million in Uluru each year.
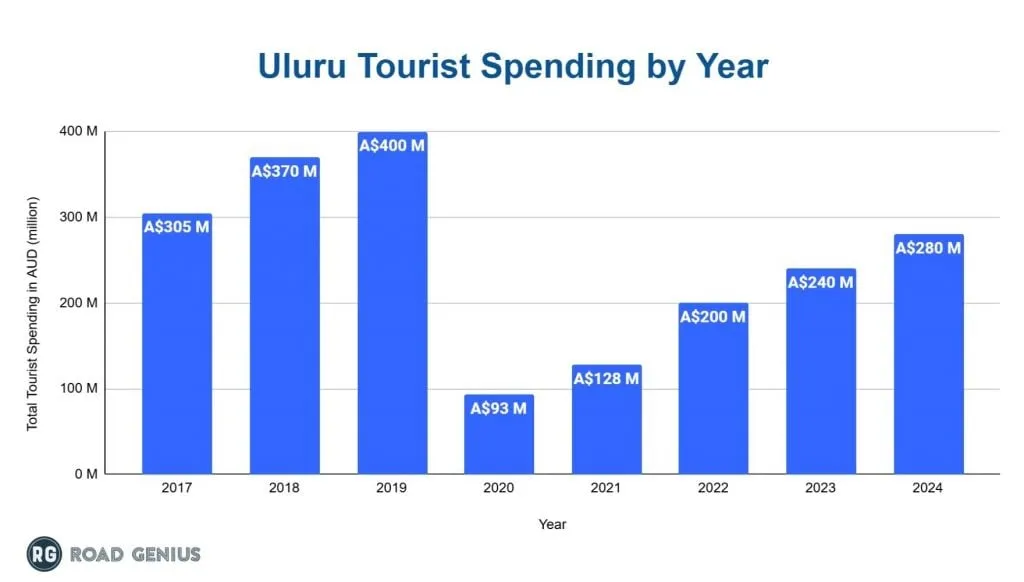
- Total tourist spending reached AUD 400 million before the pandemic in 2019, but fell during COVID-19 restrictions.
- Tourist spending in 2024 was AUD 280 million, still AUD 120 million short of pre-COVID levels, according to Tourism Central Australia.
How much do tourists spend in Uluru in 2024?
- In 2024, tourists spent A$280 million in Uluru, 17% more than in 2023, yet still 30% below the A$400 million recorded in 2019.
How much do tourists spend in Uluru in 2023?
- Tourists spent A$240 million in Uluru in 2023, an increase of 20% from 2022, and 40% below the A$400 million level achieved in 2019.
How much does it cost to visit Uluru?
The average cost to visit Uluru is approximately AUD 1,200 per trip based on typical visitor spending patterns.
- Budget travelers: Approximately AUD 445 for a 3-day camping tour from Alice Springs.
- Mid-range visitors: Approximately AUD 1,200 per person for 3-4 days, including flights from Australian cities.
- Luxury travelers: Approximately AUD 1,600 per person per night at high-end lodges like Longitude 131°.
- Park entry: Approximately AUD 38 per adult for a 3-day pass.
Which regions visit Uluru the most?
In 2023, the majority of tourists visiting Uluru were domestic travellers from Australia, with only a small percentage from international visitors.
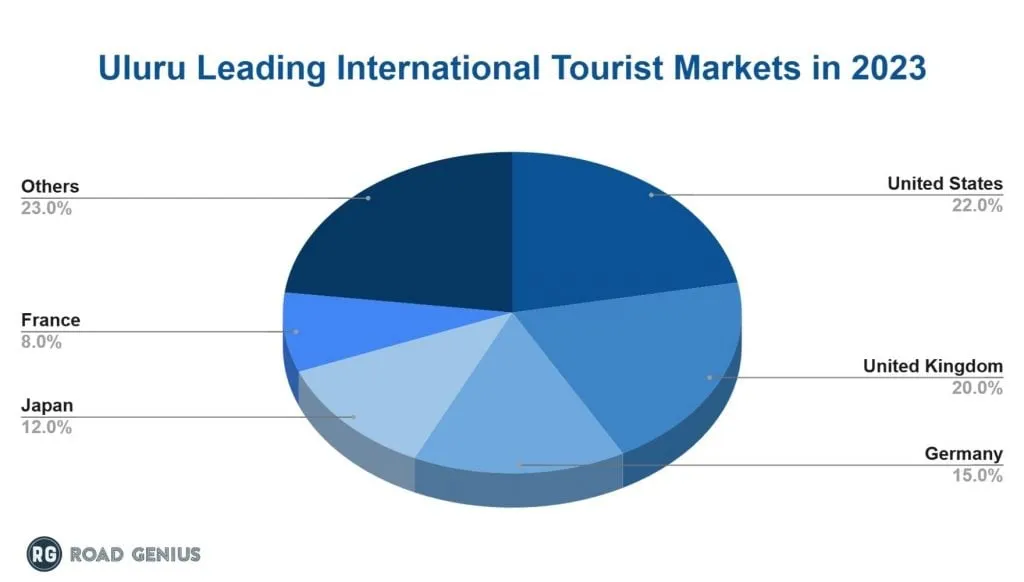
- The United States accounts for the largest share of international visitors, making up 22% of international visitors in 2023.
- Other key source markets include the United Kingdom (20%), Germany (15%), Japan (12%), and France (8%) in 2023.
Economic Impact – Uluru Tourism Statistics
- Tourism at Uluru contributed AUD 280 million annually to the regional economy in 2024.
- The sector supports 740 jobs directly in the Uluru-Kata Tjuta and surrounding region.
- Ayers Rock Resort employs 400 Indigenous staff, up from just 2 in 2010.
- Park entry fees generated AUD 8.15 million in 2019 (peak year).
- Tourism accounts for 28% of employment in the Lasseter region (which includes Uluru).
- The park’s closure in 2020 resulted in AUD 300 million in lost revenue.
Impact of COVID-19 on Uluru Tourism (2020-2021)
- Visitor numbers plummeted from approximately 407,000 in 2019 to just 93,000 in 2020 (-77%).
- The park was closed for 2.5 months in 2020, unprecedented in its history.
- International visitors dropped to virtually zero in 2020-2021.
- Domestic-only visitation in 2021 reached approximately 128,000 (100% Australian visitors).
- Recovery began in 2022 with approximately 222,000 visitors (+73% vs 2021).
- By 2023, international visitors comprised 25% of the total, compared to 50% pre-pandemic.
Why do people visit Uluru?
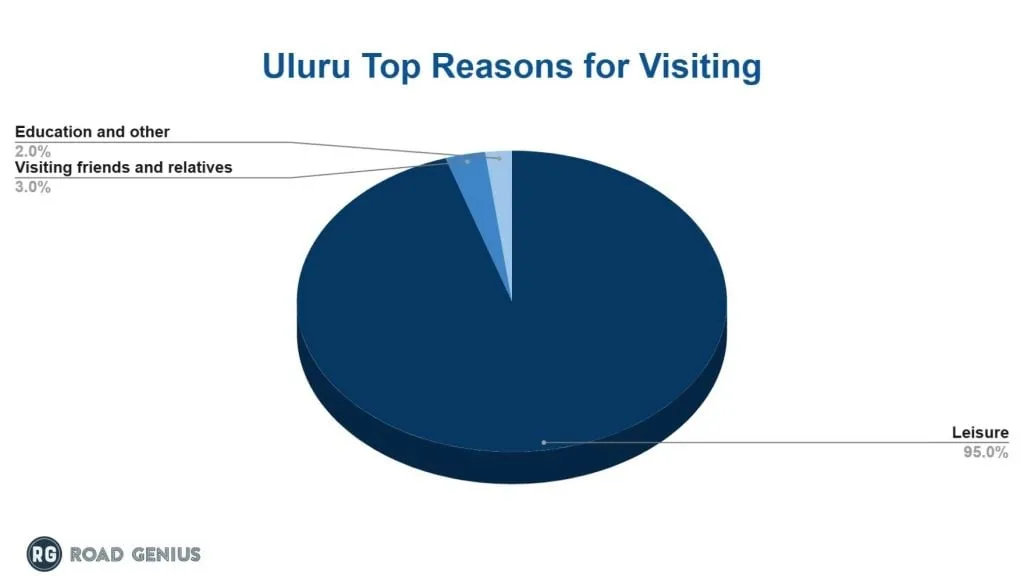
Uluru attracts visitors primarily for leisure travel (95%), with tourists coming to experience its natural wonder and cultural significance.
- Visiting friends and relatives accounts for 3% of visitors
- Education and other purposes comprise the remaining 2% of visitors
Top Activities at Uluru
- Sunset Viewing: 82% of visitors watch the sunset at Uluru
- Bush Walking: 72% explore walking trails
- Sunrise Viewing: 69% catch the sunrise
- Photography: 52% cite this as a key activity
- Rock Art Viewing: 41% explore ancient Indigenous art sites
- Free Ranger-guided Mala Walk: Popular daily activity with cultural interpretation
- Camel rides, helicopter flights, Segway tours: Adventure activities for those seeking unique perspectives
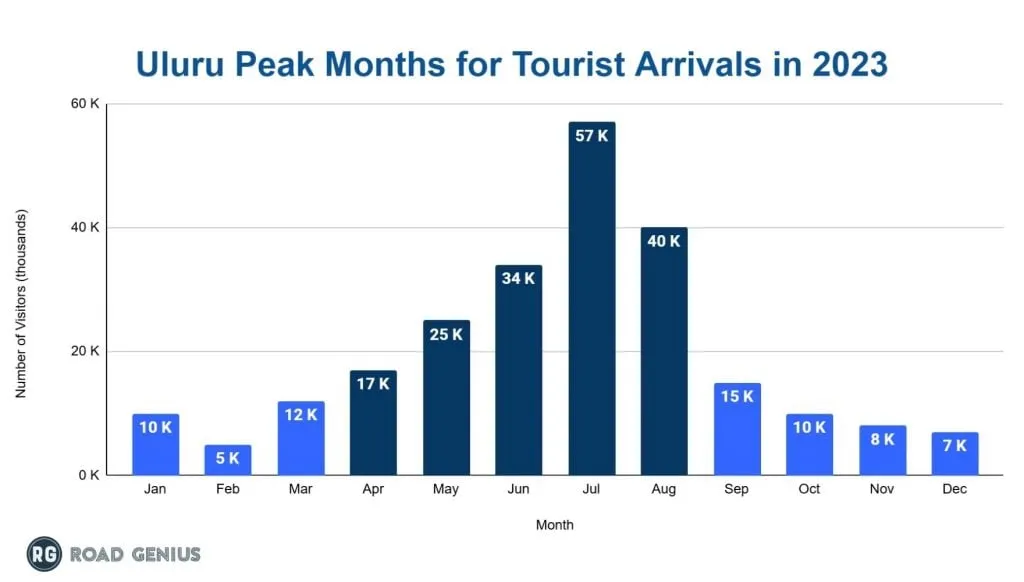
What are Uluru’s peak tourist months?
July and August are the peak tourist months for Uluru tourism in 2023.
- July is the busiest month with 57,000 visitors, followed by August with 40,000 visitors.
- June attracts 34,000 visitors, while May draws 25,000 visitors, and April sees 17,000 visitors.
- February records the lowest with 5,000 visitors, and December sees 7,000 visitors due to extreme heat.
When is the best time to visit Uluru?
The best time to visit Uluru is during the cooler winter months when desert temperatures are more comfortable.
- June-August (Winter): Peak season with cool days (20°C) and cold nights, ideal for hiking.
- April-May (Autumn): Pleasant weather with fewer crowds.
- September-October (Spring): Warming weather, moderate crowds.
- November-February (Summer): Low season with extreme heat (40°C+), many tours scale back.
How popular is Uluru as a tourist destination?
Uluru ranks among the world’s top tourist destinations.
- UNESCO World Heritage Site (dual-listed for natural and cultural values).
- Won Australia’s Tourism Award for Major Tourist Attraction in 2023.
- Part of the “tourism trinity” with the Sydney Opera House and the Great Barrier Reef.
- One of the Seven Natural Wonders of Oceania.
How long do visitors stay at Uluru?
Visitors stayed an average of approximately 3.3 nights at Uluru in 2023.
- Domestic visitors: Stay approximately 3.4 nights on average.
- International visitors: Stay approximately 2.5 nights on average, often as part of a broader Australian tour.
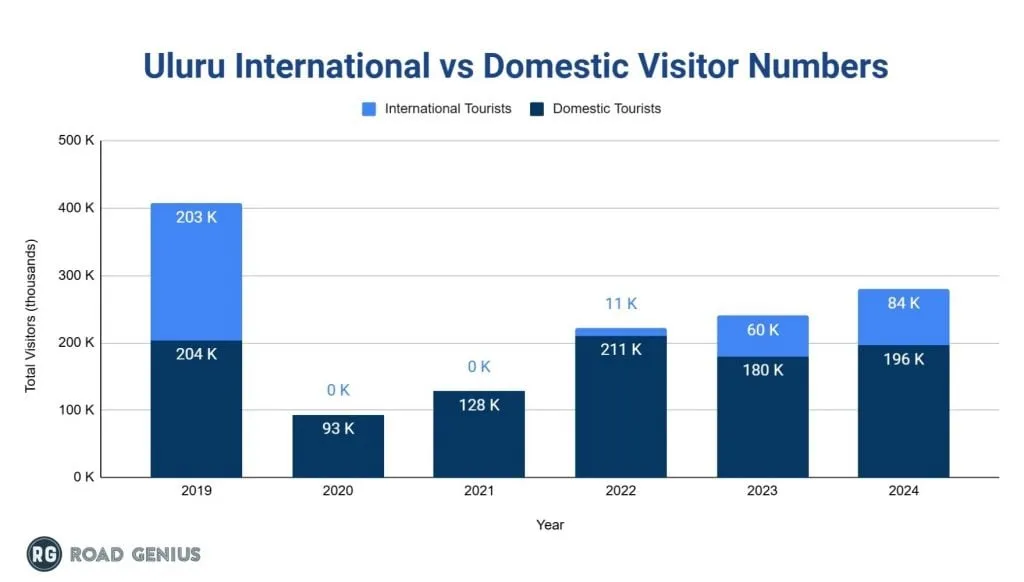
International vs Domestic Visitor Numbers at Uluru
- A total of approximately 407,000 visitors were recorded in 2019, with around 203,000 (50%) arriving from abroad and approximately 204,000 (50%) traveling domestically.
- 240,000 total arrivals took place in 2023, with 60,000 (25%) visiting internationally and 180,000 (75%) traveling domestically.
- 280,000 total visitors in 2024, with 84,000 (30%) international and 196,000 (70%) domestic visitors.
More Statistics
- Adelaide Tourism Statistics
- Australia Tourism Statistics
- Bondi Beach Tourism Statistics
- Brisbane Tourism Statistics
- Great Barrier Reef Tourism Statistics
- Great Ocean Road Tourism Statistics
- Melbourne Tourism Statistics
- Noosa Tourism Statistics
- Sydney Harbour Bridge Tourism Statistics
- Sydney Opera House Tourism Statistics
- Tasmania Tourism Statistics
- Toowoomba Tourism Statistics
What to visit at Uluru?
- Uluru (Ayers Rock): Almost all visitors see the monolith, with 348-meter height and 9.4 km circumference.
- Kata Tjuta (The Olgas): 168,000 visitors (70%) explore these 36 domed rock formations.
- Cultural Centre: 216,000 visitors (90%) stop at this free facility to learn about Anangu culture.
- Mutitjulu Waterhole: 144,000 visitors (60%) visit this popular stop on the Uluru base walk.
- Valley of the Winds (Kata Tjuta): 96,000 visitors (40%) hike this popular trail.
- Walpa Gorge (Kata Tjuta): 120,000 visitors (50%) walk this easier trail.
- Talinguru Nyakunytjaku: 196,800 visitors (82%) use the sunrise and sunset viewing areas.
References
- Tourism Key Figures and Statistics · dcceew.gov.au